Nonlinear Regression
What Are Parametric Nonlinear Regression Models?
Parametric nonlinear models represent the relationship between a continuous response variable and one or more continuous predictor variables in the form
y = f(X,β) + ε,
where
y is an n-by-1 vector of observations of the response variable.
f is any function of X and β that evaluates each row of X along with the vector β to compute the prediction for the corresponding row of y.
X is an n-by-p matrix of predictors, with one row for each observation, and one column for each predictor.
β is a p-by-1 vector of unknown parameters to be estimated.
ε is an n-by-1 vector of independent, identically distributed random disturbances.
In contrast, nonparametric models do not attempt to characterize the relationship between predictors and response with model parameters. Descriptions are often graphical, as in the case of Decision Trees.
fitnlm attempts to find
values of the parameters β that minimize
the mean squared differences between the observed responses y and
the predictions of the model f(X,β).
To do so, it needs a starting value beta0 before
iteratively modifying the vector β to a vector
with minimal mean squared error.
Prepare Data
To begin fitting a regression, put your data into a form that
fitting functions expect. All regression techniques begin with input
data in an array X and response data in a separate
vector y, or input data in a table or dataset array tbl and
response data as a column in tbl. Each row of the
input data represents one observation. Each column represents one
predictor (variable).
For a table or dataset array tbl, indicate
the response variable with the 'ResponseVar' name-value
pair:
mdl = fitlm(tbl,'ResponseVar','BloodPressure');
The response variable is the last column by default.
You cannot use categorical predictors for nonlinear regression. A categorical predictor is one that takes values from a fixed set of possibilities.
Represent missing data as NaN for both input
data and response data.
Dataset Array for Input and Response Data
For example, to create a dataset array from an Excel® spreadsheet:
ds = dataset('XLSFile','hospital.xls',...
    'ReadObsNames',true);
To create a dataset array from workspace variables:
load carsmall
ds = dataset(Weight,Model_Year,MPG);
Table for Input and Response Data
To create a table from an Excel spreadsheet:
tbl = readtable('hospital.xls',...
    'ReadRowNames',true);
To create a table from workspace variables:
load carsmall
tbl = table(Weight,Model_Year,MPG);
Numeric Matrix for Input Data and Numeric Vector for Response
For example, to create numeric arrays from workspace variables:
load carsmall
X = [Weight Horsepower Cylinders Model_Year];
y = MPG;
To create numeric arrays from an Excel spreadsheet:
[X, Xnames] = xlsread('hospital.xls');
y = X(:,4); % response y is systolic pressure
X(:,4) = []; % remove y from the X matrix
Notice that the nonnumeric entries, such as sex,
do not appear in X.
Represent the Nonlinear Model
There are several ways to represent a nonlinear model. Use whichever is most convenient.
The nonlinear model is a required input to fitnlm, in the modelfun input.
fitnlm assumes that the response function f(X,β)
is smooth in the parameters β. If your function
is not smooth, fitnlm can fail to provide optimal
parameter estimates.
Function Handle to Anonymous Function or Function File
The function handle @modelfun(b,x) accepts
a vector b and matrix, table, or dataset array x.
The function handle should return a vector f with
the same number of rows as x. For example, the
function file hougen.m computes
Examine the function by entering type hougen at the MATLAB® command line.
function yhat = hougen(beta,x)
%HOUGEN Hougen-Watson model for reaction kinetics.
%   YHAT = HOUGEN(BETA,X) gives the predicted values of the
%   reaction rate, YHAT, as a function of the vector of
%   parameters, BETA, and the matrix of data, X.
%   BETA must have 5 elements and X must have three
%   columns.
%
%   The model form is:
%   y = (b1*x2 - x3/b5)./(1+b2*x1+b3*x2+b4*x3)
%
%   Reference:
%      [1]  Bates, Douglas, and Watts, Donald, "Nonlinear
%      Regression Analysis and Its Applications", Wiley
%      1988 p. 271-272.

%   Copyright 1993-2004 The MathWorks, Inc.
%   B.A. Jones 1-06-95.

b1 = beta(1);
b2 = beta(2);
b3 = beta(3);
b4 = beta(4);
b5 = beta(5);

x1 = x(:,1);
x2 = x(:,2);
x3 = x(:,3);

yhat = (b1*x2 - x3/b5)./(1+b2*x1+b3*x2+b4*x3);
You can write an anonymous function that performs the same calculation
as hougen.m.
modelfun = @(b,x)(b(1)*x(:,2) - x(:,3)/b(5))./...
(1 + b(2)*x(:,1) + b(3)*x(:,2) + b(4)*x(:,3));
Text Representation of Formula
For data in a matrix X and response in a
vector y:
Represent the formula using
'x1'as the first predictor (column) inX,'x2'as the second predictor, etc.Represent the vector of parameters to optimize as
'b1','b2', etc.Write the formula as
'y ~ (mathematical expressions)'.
For example, to represent the response to the reaction data:
modelfun = 'y ~ (b1*x2 - x3/b5)/(1 + b2*x1 + b3*x2 + b4*x3)';
For data in a table or dataset array, you can use formulas represented
as the variable names from the table or dataset array. Put the response
variable name at the left of the formula, followed by a ~,
followed by a character vector representing the response formula.
This example shows how to create a character vector to represent
the response to the reaction data that is in a
dataset array.
Load the
reactiondata.load reaction
Put the data into a dataset array, where each variable has a name given in
xnoryn.ds = dataset({reactants,xn(1,:),xn(2,:),xn(3,:)},... {rate,yn});Examine the first row of the dataset array.
ds(1,:)

ans =

    Hydrogen    n_Pentane    Isopentane    ReactionRate
    470         300          10            8.55
Write the
hougenformula using names in the dataset array.modelfun = ['ReactionRate ~ (b1*n_Pentane - Isopentane/b5) /'... ' (1 + Hydrogen*b2 + n_Pentane*b3 + Isopentane*b4)'] modelfun = ReactionRate ~ (b1*n_Pentane - Isopentane/b5) / ... (1 + Hydrogen*b2 + n_Pentane*b3 + Isopentane*b4)
Choose Initial Vector beta0
The initial vector for the fitting iterations, beta0,
can greatly influence the quality of the resulting fitted model. beta0 gives
the dimensionality of the problem, meaning it needs the correct length.
A good choice of beta0 leads to a quick, reliable
model, while a poor choice can lead to a long computation, or to an
inadequate model.
It is difficult to give advice on choosing a good beta0.
If you believe certain components of the vector should be positive
or negative, set your beta0 to have those characteristics.
If you know the approximate value of other components, include them
in beta0. However, if you don’t know good
values, try a random vector, such as
beta0 = randn(nVars,1);
% or
beta0 = 10*rand(nVars,1);
Fit Nonlinear Model to Data
The syntax for fitting a nonlinear regression model using a
table or dataset array tbl is
mdl = fitnlm(tbl,modelfun,beta0)
The syntax for fitting a nonlinear regression model using a
numeric array X and numeric response vector y is
mdl = fitnlm(X,y,modelfun,beta0)
For information on representing the input parameters, see Prepare Data, Represent the Nonlinear Model, and Choose Initial Vector beta0.
fitnlm assumes that the response variable
in a table or dataset array tbl is the last column.
To change this, use the ResponseVar name-value
pair to name the response column.
Examine Quality and Adjust the Fitted Nonlinear Model
There are diagnostic plots to help you examine the quality of a model. plotDiagnostics(mdl) gives a variety of plots, including leverage and Cook's distance plots. plotResiduals(mdl) gives the difference between the fitted model and the data.
There are also properties of mdl that relate to the model quality. mdl.RMSE gives the root mean square error between the data and the fitted model. mdl.Residuals.Raw gives the raw residuals. mdl.Diagnostics contains several fields, such as Leverage and CooksDistance, that can help you identify particularly interesting observations.
This example shows how to examine a fitted nonlinear model using diagnostic, residual, and slice plots.
Load the sample data.
load reactionCreate a nonlinear model of rate as a function of reactants using the hougen.m function.
beta0 = ones(5,1);
mdl = fitnlm(reactants,...
    rate,@hougen,beta0);
Make a leverage plot of the data and model.
plotDiagnostics(mdl)
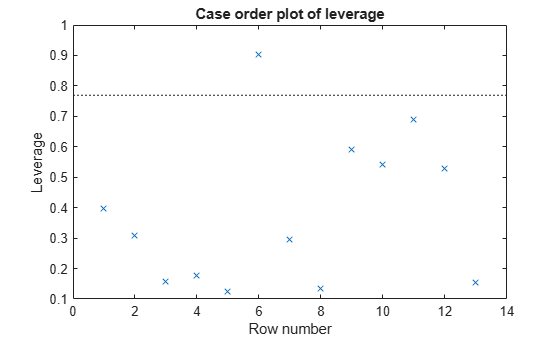
There is one point that has high leverage. Locate the point.
[~,maxl] = max(mdl.Diagnostics.Leverage)
maxl = 6
Examine a residuals plot.
plotResiduals(mdl,'fitted')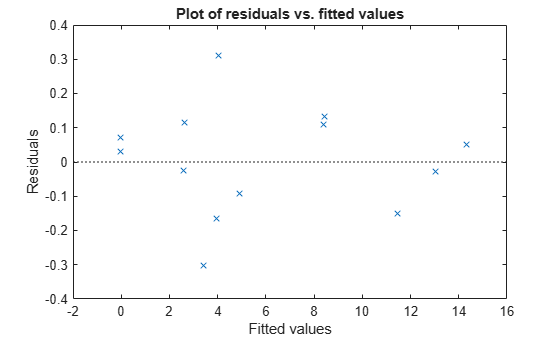
Nothing stands out as an outlier.
Use a slice plot to show the effect of each predictor on the model.
plotSlice(mdl)
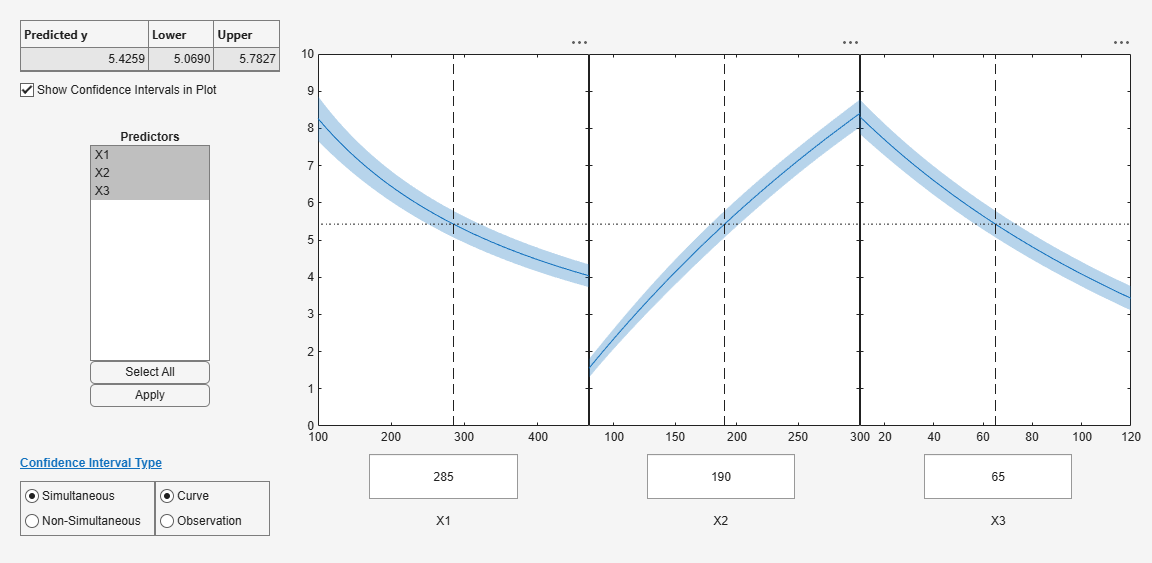
You can drag the vertical dashed blue lines to see the effect of a change in one predictor on the response. For example, drag the X2 line to the right, and notice that the slope of the X3 line changes.
Predict or Simulate Responses Using a Nonlinear Model
This example shows how to use the methods predict, feval, and random to predict and simulate responses to new data.
Randomly generate a sample from a Cauchy distribution.
rng('default')
X = rand(100,1);
X = tan(pi*X - pi/2);
Generate the response according to the model y = b1*(pi /2 + atan((x - b2) / b3)) and add noise to the response.
modelfun = @(b,x) b(1) * ...
    (pi/2 + atan((x - b(2))/b(3)));
y = modelfun([12 5 10],X) + randn(100,1);
Fit a model starting from the arbitrary parameters b = [1,1,1].
beta0 = [1 1 1]; % An arbitrary guess
mdl = fitnlm(X,y,modelfun,beta0)
mdl =
Nonlinear regression model:
y ~ b1*(pi/2 + atan((x - b2)/b3))
Estimated Coefficients:
Estimate SE tStat pValue
________ _______ ______ __________
b1 12.082 0.80028 15.097 3.3151e-27
b2 5.0603 1.0825 4.6747 9.5063e-06
b3 9.64 0.46499 20.732 2.0382e-37
Number of observations: 100, Error degrees of freedom: 97
Root Mean Squared Error: 1.02
R-Squared: 0.92, Adjusted R-Squared 0.918
F-statistic vs. zero model: 6.45e+03, p-value = 1.72e-111
The fitted values are within a few percent of the parameters [12,5,10].
Examine the fit.
plotSlice(mdl)
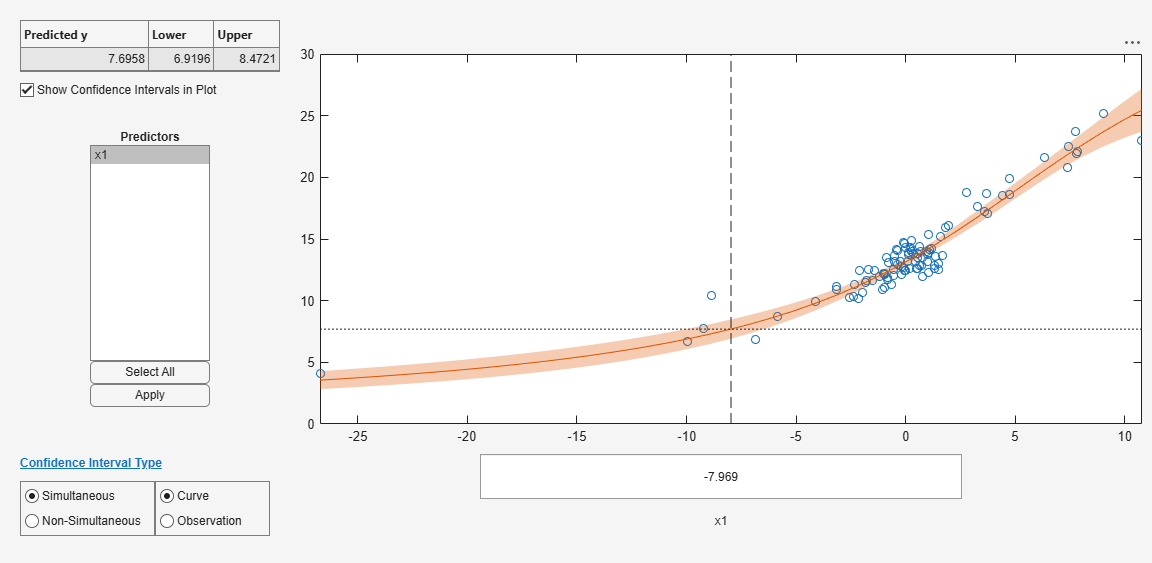
predict
The predict method predicts the mean responses and, if requested, gives confidence bounds. Find the predicted response values and predicted confidence intervals about the response at X values [-15;5;12].
Xnew = [-15;5;12];
[ynew,ynewci] = predict(mdl,Xnew)
ynew = 3×1

    5.4122
   18.9022
   26.5161
ynewci = 3×2

    4.8233    6.0010
   18.4555   19.3490
   25.0170   28.0151
The confidence intervals are reflected in the slice plot.
feval
The feval method predicts the mean responses. feval is often more convenient to use than predict when you construct a model from a dataset array.
Create the nonlinear model from a dataset array.
ds = dataset({X,'X'},{y,'y'});
mdl2 = fitnlm(ds,modelfun,beta0);
Find the predicted model responses (CDF) at X values [-15;5;12].
Xnew = [-15;5;12];
ynew = feval(mdl2,Xnew)
ynew = 3×1

    5.4122
   18.9022
   26.5161
random
The random method simulates new random response values, equal to the mean prediction plus a random disturbance with the same variance as the training data.
Xnew = [-15;5;12];
ysim = random(mdl,Xnew)
ysim = 3×1

    6.0505
   19.0893
   25.4647
Rerun the random method. The results change.
ysim = random(mdl,Xnew)
ysim = 3×1

    6.3813
   19.2157
   26.6541
You can also select a web site from the following list:
Americas
- América Latina (Español)
- Canada (English)
- United States (English)
Europe
- Belgium (English)
- Denmark (English)
- Deutschland (Deutsch)
- España (Español)
- Finland (English)
- France (Français)
- Ireland (English)
- Italia (Italiano)
- Luxembourg (English)
- Netherlands (English)
- Norway (English)
- Österreich (Deutsch)
- Portugal (English)
- Sweden (English)
- Switzerland
- United Kingdom (English)