plot
Plot boundary of 2-D shape
Description
plot( plots the boundary of the
specified shape.shape)
plot(
plots the boundary of the specified shape with additional properties specified by
the Name-Value Arguments.shape,Name=Value)
p = plot(shape,Name=Value)
Examples
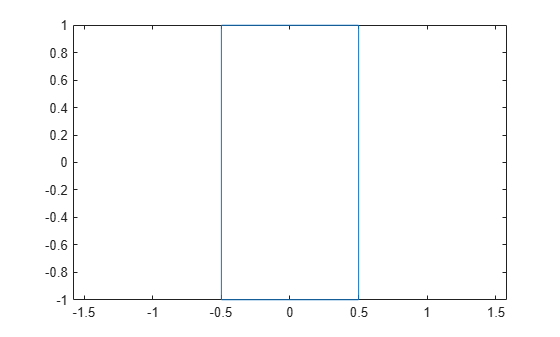
Plot Rectangle Shape
Create a rectangular shape and plot its boundary.
r = shape.Rectangle;
p = plot(r);
Input Arguments
Output Arguments
Version History
Introduced in R2017a
You can also select a web site from the following list:
Americas
- América Latina (Español)
- Canada (English)
- United States (English)
Europe
- Belgium (English)
- Denmark (English)
- Deutschland (Deutsch)
- España (Español)
- Finland (English)
- France (Français)
- Ireland (English)
- Italia (Italiano)
- Luxembourg (English)
- Netherlands (English)
- Norway (English)
- Österreich (Deutsch)
- Portugal (English)
- Sweden (English)
- Switzerland
- United Kingdom (English)