Contenu principal

Integrate Function with Variable Number of Arguments

R2026b

This example shows you how to create a .NET application using a MATLAB® function that takes a variable number of arguments instead of just one.

In this example, you perform the following steps:

  • Use the MATLAB Compiler SDK™ product to convert the MATLAB function drawgraph to a method of a .NET class (Plotter) and wrap the class in a .NET assembly (VarArgComp). The drawgraph function displays a plot of the input parameters and is called as a method of the Plotter class.

  • Access the component in a C# application (VarArgApp.cs) or a Visual Basic® application (VarArgApp.vb) by instantiating the Plotter class and using MWArray to represent data.

  • Build and run the VarArgDemoApp application using the Visual Studio® .NET development environment.

Files

MATLAB Functionsdrawgraph.m
extractcoords.m
MATLAB Function Locationmatlabroot\toolbox\dotnetbuilder\Examples\VSVersion\NET\VarArgExample\VarArgComp\
C# Code Locationmatlabroot\toolbox\dotnetbuilder\Examples\VSVersion\NET\VarArgExample\VarArgCSApp\VarArgApp.cs
Visual Basic Code Locationmatlabroot\toolbox\dotnetbuilder\Examples\VSVersion\NET\VarArgExample\VarArgVBApp\VarArgApp.vb

Procedure

  1. Copy the following folder that ships with the MATLAB product to your work folder:

    matlabroot\toolbox\dotnetbuilder\Examples\VSVersion\NET\VarArgExample
    

    At the MATLAB command prompt, navigate to the new VarArgExample\VarArgComp subfolder in your work folder.

  2. Examine the drawgraph and extractcoords functions.

    function [xyCoords] = DrawGraph(colorSpec, varargin)
    
        numVarArgIn= length(varargin);
        xyCoords= zeros(numVarArgIn, 2);
    
        for idx = 1:numVarArgIn
            xCoord = varargin{idx}(1);
            yCoord = varargin{idx}(2);
            
            x(idx) = xCoord;
            y(idx) = yCoord;
            
            xyCoords(idx,1) = xCoord;
            xyCoords(idx,2) = yCoord;
        end
        
        xmin = min(0, min(x));
        ymin = min(0, min(y));
    
        axis([xmin fix(max(x))+3 ymin fix(max(y))+3])
        
        plot(x, y, 'color', colorSpec);


    function [varargout] = ExtractCoords(coords)
    
        for idx = 1:nargout
            varargout{idx}= coords(idx,:);
        end
    

  3. Build the .NET component with the .NET Assembly Compiler app or compiler.build.dotNETAssembly using the following information:

    FieldValue
    Library NameVarArgComp
    Class NamePlotter
    Files to Compileextractcoords.m   drawgraph.m

    For example, if you are using compiler.build.dotNETAssembly, type:

    buildResults = compiler.build.dotNETAssembly(["extractcoords.m","drawgraph.m"], ...
    'AssemblyName','VarArgComp', ...
    'ClassName','Plotter');

    For more details, see the instructions in Generate MWArray .NET Assembly and Build .NET Application.

  4. Decide whether you are using C# or Visual Basic to access the component.

    • C#

      If you are using C#, write source code for a C# application that accesses the component.

      The sample application for this example is in VarArgExample\VarArgCSApp\VarArgApp.cs.

      using System;
      
      using MathWorks.MATLAB.NET.Utility;
      using MathWorks.MATLAB.NET.Arrays;
      
      using VarArgComp;
      
      
      namespace MathWorks.Examples.VarArgApp
       {
        /// <summary>
        /// This application demonstrates how to call components 
        ///  having methods with varargin/vargout arguments.
        /// </summary>
        class VarArgApp
          {
            #region MAIN
      
            /// <summary>
            /// The main entry point for the application.
            /// </summary>
            [STAThread]
            static void Main(string[] args)
              {
                // Initialize the input data
                MWNumericArray colorSpec= new double[]
                                              {0.9, 0.0, 0.0};
                MWNumericArray data= 
                        new MWNumericArray(new int[,]{{1,2},{2,4},
                                             {3,6},{4,8},{5,10}});  
                MWArray[] coords= null;
      
                try
                  {
                    // Create a new plotter object
                    Plotter plotter= new Plotter();
      
                    //Extract a variable number of two element x and y coordinate 
                    //  vectors from the data array
                    coords= plotter.extractcoords(5, data);
      
                    // Draw a graph using the specified color to connect the 
                    //   variable number of input coordinates.
                    // Return a two column data array containing the input coordinates.
                    data= (MWNumericArray)plotter.drawgraph(colorSpec, 
                      coords[0], coords[1], coords[2],coords[3], coords[4]);
      
                    Console.WriteLine("result=\n{0}", data);
      
                    Console.ReadLine();  // Wait for user to exit application
      
                    // Note: You can also pass in the coordinate array directly.
                    data= (MWNumericArray)plotter.drawgraph(colorSpec, coords);
      
                    Console.WriteLine("result=\n{0}", data); 
       
                    Console.ReadLine();  // Wait for user to exit application
                  }
      
                catch(Exception exception)
                  {
                    Console.WriteLine("Error: {0}", exception);
                  }
              }
      
            #endregion
          }
        }
      

      The following statements are alternative ways to call the drawgraph method:

      data= (MWNumericArray)plotter.drawgraph(colorSpec, 
                      coords[0], coords[1], coords[2],coords[3], coords[4]);
      ...
      data= (MWNumericArray)plotter.drawgraph((MWArray)colorSpec, coords);
      
    • Visual Basic

      If you are using Visual Basic, write source code for a Visual Basic application that accesses the component.

      The sample application for this example is in VarArgExample\VarArgVBApp\VarArgApp.vb.

      Imports System
      
      Imports MathWorks.MATLAB.NET.Utility
      Imports MathWorks.MATLAB.NET.Arrays
      
      Imports VarArgComp
      
      
      Namespace MathWorks.Demo.VarArgDemoApp
      
      
      ' <summary>
      ' This application demonstrates how to call components having methods with 
      '   varargin/vargout arguments.
      ' </summary>
      Class VarArgDemoApp
          
      #Region " MAIN "
      
              ' <summary>
              ' The main entry point for the application.
              ' </summary>
              Shared Sub Main(ByVal args() As String)
      
                  ' Initialize the input data
                  Dim colorSpec As MWNumericArray = 
                    New MWNumericArray(New Double() {0.9, 0.0, 0.0})
                  Dim data As MWNumericArray = 
                    New MWNumericArray(New Integer(,) {{1, 2}, {2, 4}, {3, 6}, {4, 8}, {5, 10}})
                  Dim coords() As MWArray = Nothing
      
                  Try
      
                      ' Create a new plotter object
                      Dim plotter As Plotter = New Plotter
      
                      'Extract a variable number of two element x and y coordinate 
                      ' vectors from the data array
                      coords = plotter.extractcoords(5, data)
      
                      ' Draw a graph using the specified color to connect the variable number of 
                      '  input coordinates.
                      ' Return a two column data array containing the input coordinates.
                      data = CType(plotter.drawgraph(colorSpec, coords(0), coords(1), coords(2), 
                         coords(3), coords(4)), _
                                   MWNumericArray)
      
                      Console.WriteLine("result={0}{1}", Chr(10), data)
      
                      Console.ReadLine()  ' Wait for user to exit application
      
                      ' Note: You can also pass in the coordinate array directly.
                      data = CType(plotter.drawgraph(colorSpec, coords), MWNumericArray)
      
                      Console.WriteLine("result=\{0}{1}", Chr(10), data)
      
                      Console.ReadLine()  ' Wait for user to exit application
      
      
                  Catch exception As Exception
                      Console.WriteLine("Error: {0}", exception)
                  End Try
              End Sub
      #End Region
      
          End Class
      End Namespace
      

      The following statements are alternative ways to call the drawgraph method:

      data = CType(plotter.drawgraph(colorSpec, coords(0), coords(1), coords(2), 
             coords(3), coords(4)), MWNumericArray)
      ...
      data = CType(plotter.drawgraph(colorSpec, coords), MWNumericArray)

    In either case, the VarArgApp program does the following:

    • Initializes three arrays (colorSpec, data, and coords) using the MWArray class library

    • Creates a Plotter object

    • Calls the extracoords and drawgraph methods

    • Uses MWNumericArray to represent the data needed by the methods

    • Uses a try-catch block to catch and handle any exceptions

  5. Open the .NET project file that corresponds to your application language using Visual Studio.

    • C#

      If you are using C#, the VarArgCSApp folder contains a Visual Studio .NET project file for this example. Open the project in Visual Studio .NET by double-clicking VarArgCSApp.csproj in Windows® Explorer. You can also open it from the desktop by right-clicking VarArgCSApp.csproj and selecting Open Outside MATLAB.

    • Visual Basic

      If you are using Visual Basic, the VarArgVBApp folder contains a Visual Studio .NET project file for this example. Open the project in Visual Studio .NET by double-clicking VarArgVBApp.vbproj in Windows Explorer. You can also open it from the desktop by right-clicking VarArgVBApp.vbproj and selecting Open Outside MATLAB.

  6. Create a reference to your assembly file VarArgComp.dll located in the folder where you generated or installed the assembly.

  7. Create a reference to the MWArray API.

    If MATLAB is installed on your systemmatlabroot\toolbox\dotnetbuilder\bin\win64\<framework_version>\MWArray.dll
    If MATLAB Runtime is installed on your system<MATLAB_RUNTIME_INSTALL_DIR>\toolbox\dotnetbuilder\bin\win64\<framework_version>\MWArray.dll

  8. Build and run the VarArgApp application in Visual Studio .NET.

    The program displays the following output:

    result=
         1     2
         2     4
         3     6
         4     8
         5    10
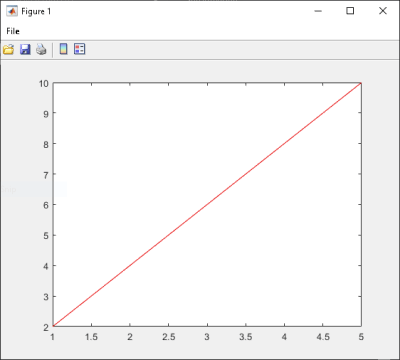
    
    A figure that displays the line created by the coordinates {1, 2}, {2, 4}, {3, 6}, {4, 8}, and {5, 10}.

See Also

Topics