Aggregate Stack Usage Profiles to Identify Most Demanding Execution
You can run simulations that test generated code, producing stack usage metrics for the generated code – see View and Compare Stack Usage Metrics. During model development, you can use the metrics to observe the memory demands of the generated code. The information you obtain is simulation-specific and dependent on the test inputs. Near the end of model development, you can:
Use your test bench to rerun all your tests.
Aggregate stack usage profiles produced by the tests.
You can perform the steps manually or automatically depending on how you provide model inputs and run simulations.
Use the aggregate of execution-time profiles to identify and analyze the most demanding task execution and test.
Workflow for Creating Aggregate of Stack Usage Profiles
To create an aggregate of stack usage profiles, use this workflow:
Using the Simulink® model, design, and optimize your algorithm.
Configure the model to run the generated code and perform stack usage profiling, using one of these simulations:
Software-in-the-loop (SIL), which you run on your development computer.
Processor-in-the-loop (PIL), which you run on target hardware by using a target support package or a custom target application.
Create a
coder.profile.ExecutionStackSetobject for storing stack usage profiles.For all your test cases:
Configure model inputs.
Run a simulation.
Add the stack usage profile created by the simulation to the
coder.profile.ExecutionStackSetobject.
If you have a Simulink Test™ file of test cases or a model that provides inputs, you can use
coder.profile.test.runTeststo automate this step.
Use the Code Profile Analyzer to process the aggregate of profiles, which enables you, for example, to identify the most demanding execution for each task.
Manually Aggregate Stack Usage Profiles to Identify Most Demanding Task Execution
In this example:
Using specific test inputs, run SIL simulations that exercise different paths in a model and generated code.
Aggregate stack usage profiles produced by the SIL simulations.
Identify the test input and code path that require the most stack memory.
Configure Stack Usage Profiling in SIL Simulation
Configure a SIL simulation model that generates a workspace variable containing stack-usage measurements.
model='SILTopModel';
close_system(model,0)
open_system(model)
Disable Simulink Coverage™ and third-party code coverage analysis.
set_param(model,...
          'CovEnable', 'off');
covSettings = get_param(model, 'CodeCoverageSettings');
covSettings.CoverageTool = 'None';
set_param(model, 'CodeCoverageSettings', covSettings);
Disable code execution time profiling.
set_param(model,...
          'CodeExecutionProfiling', 'off');
set_param(model,...
          'CodeProfilingInstrumentation', 'off');
Enable stack usage profiling.
set_param(model,...
    'CodeStackProfiling', 'on');
Create Object for Profile Aggregate
Create an object for storing results from model simulations.
resultsObject = coder.profile.ExecutionStackSet(model);
Create and Run Test Cases
The example model contains two triggered subsystems. The third and fourth inputs, counter_mode and count_enabled, control the execution of the triggered subsystems. To simplify the analysis, assume that the first and second inputs, ticks_to_count and reset, contain values that exercise all associated code paths.
To analyze stack usage metrics for different test cases, run multiple simulations, storing results after each simulation.
First, run a simulation that allows you to analyze stack usage for the case where CounterTypeA is triggered and CounterTypeB is disabled.
counter_mode.signals.values = false(1,101)';
simOut = sim(model, 'ReturnWorkspaceOutputs', 'on');
### Searching for referenced models in model 'SILTopModel'.
### Total of 1 models to build.
### Starting build procedure for: SILTopModel
### Successful completion of build procedure for: SILTopModel

Build Summary

Top model targets:

Model        Build Reason                                         Status                        Build Duration
==============================================================================================================
SILTopModel  Information cache folder or artifacts were missing.  Code generated and compiled.  0h 0m 15.312s

1 of 1 models built (0 models already up to date)
Build duration: 0h 0m 16.301s
### Preparing to start SIL simulation ...
Building with 'gcc'.
MEX completed successfully.
### Updating code generation report with SIL files ...
### Starting SIL simulation for component: SILTopModel
### Application stopped
### Stopping SIL simulation for component: SILTopModel
Add stack usage profile to object.
resultsObject.add('CounterA Test', simOut.stackProfile);Next, run a simulation where only CounterTypeB is triggered.
counter_mode.signals.values = true(1,101)';
simOut = sim(model, 'ReturnWorkspaceOutputs', 'on');
### Searching for referenced models in model 'SILTopModel'.
### Total of 1 models to build.
### Starting build procedure for: SILTopModel
### Generated code for 'SILTopModel' is up to date because no structural, parameter or code replacement library changes were found.
### Successful completion of build procedure for: SILTopModel

Build Summary

0 of 1 models built (1 models already up to date)
Build duration: 0h 0m 2.3685s
### Preparing to start SIL simulation ...
### Starting SIL simulation for component: SILTopModel
### Application stopped
### Stopping SIL simulation for component: SILTopModel
Add stack usage profile to object.
resultsObject.add('CounterB Test', simOut.stackProfile);Finally, run a simulation to observe the effect of the count_enable input. For this simulation, create a test case that:
After each step, enables or disables the counters.
In the first half of the simulation, uses
CounterTypeA.In the second half of the simulation, uses
CounterTypeB.
count_enable.signals.values(1:2:end) = false;
counter_mode.signals.values(1:50) = false;
counter_mode.signals.values(51:end) = true;
simOut = sim(model, 'ReturnWorkspaceOutputs', 'on');
### Searching for referenced models in model 'SILTopModel'.
### Total of 1 models to build.
### Starting build procedure for: SILTopModel
### Generated code for 'SILTopModel' is up to date because no structural, parameter or code replacement library changes were found.
### Successful completion of build procedure for: SILTopModel

Build Summary

0 of 1 models built (1 models already up to date)
Build duration: 0h 0m 1.9666s
### Preparing to start SIL simulation ...
### Starting SIL simulation for component: SILTopModel
### Application stopped
### Stopping SIL simulation for component: SILTopModel
Add stack usage profile to object.
resultsObject.add('Count Enable Test', simOut.stackProfile);Access and Analyze Results
If you want to extract specific simulation results from the object, use the get function. For example:
stackUsageProfileForRun2 = resultsObject.get('CounterB Test');Use the Code Profile Analyzer to process results contained in the profile aggregate.
coder.profile.show(resultsObject)

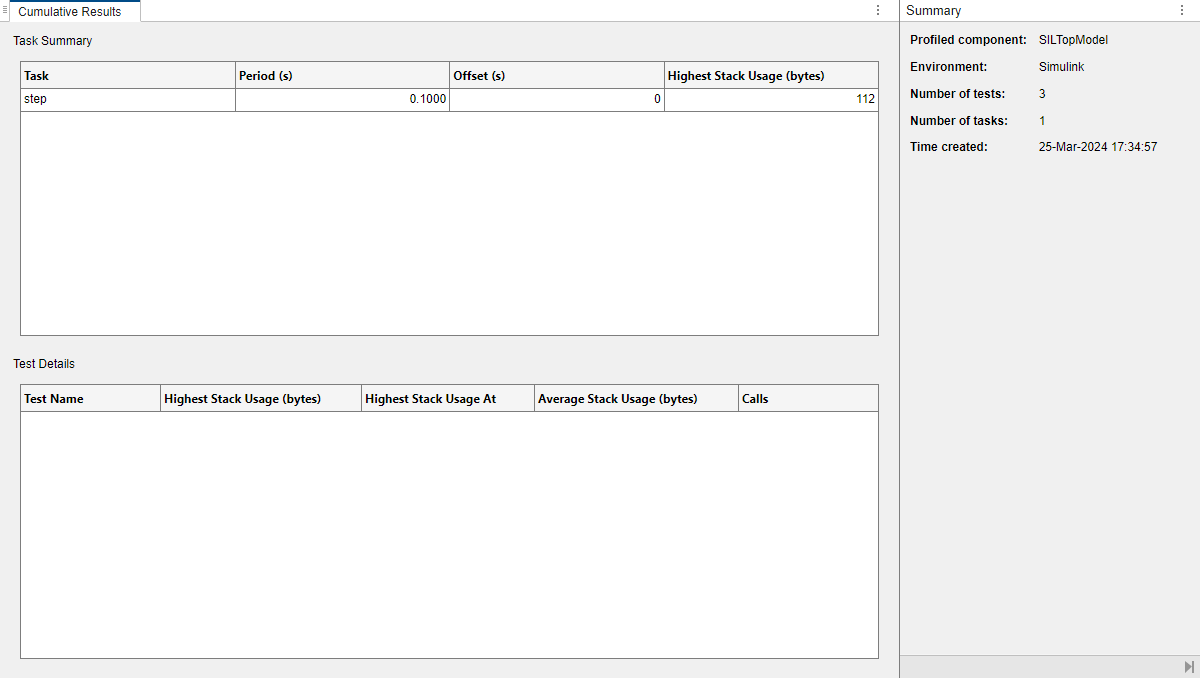
On the Cumulative Results panel, the Task Summary view displays profiled tasks. For this model, only a single task, step, is generated. To investigate the task, click the row that contains step.

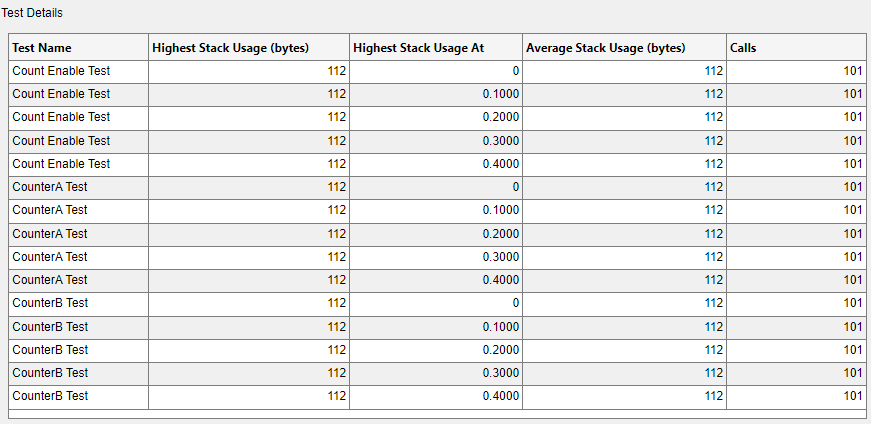
In the Test Details view, the columns provide this information:
Test Name — Name of test. For example,
CounterA Test,CounterB Test, orCount Enable Test.Highest Stack Usage (bytes) — Maximum stack memory that the task execution uses. In this example, the column provides stack usage values for the five most demanding executions of each simulation.
Highest Stack Usage At — Simulation time at which maximum stack usage occurred.
Average Stack Usage (bytes) — Average value of task stack usage over simulation.
Calls — Number of task calls.
If you want to view details for a different number of task executions, modify the ResultsPerTest property of the coder.profile.ExecutionStackSet object. For example, in the Command Window, enter:
resultsObject.ResultsPerTest=10;
To identify the corresponding code or model path for the most demanding execution:
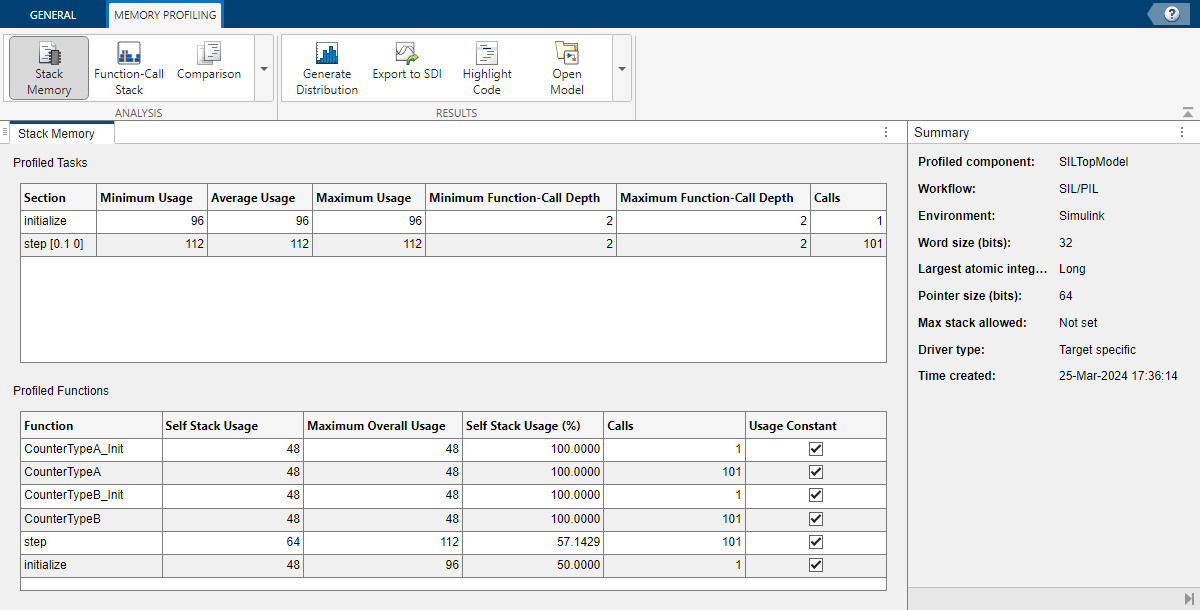
In the Test Details view, click the row that contains the highest stack usage value. Because the value is constant at 112 bytes for all tests, you can use the first row.
In the Results section of the toolstrip, click Open Test Result. The Code Profile Analyzer displays the profile for
Count Enable Test.
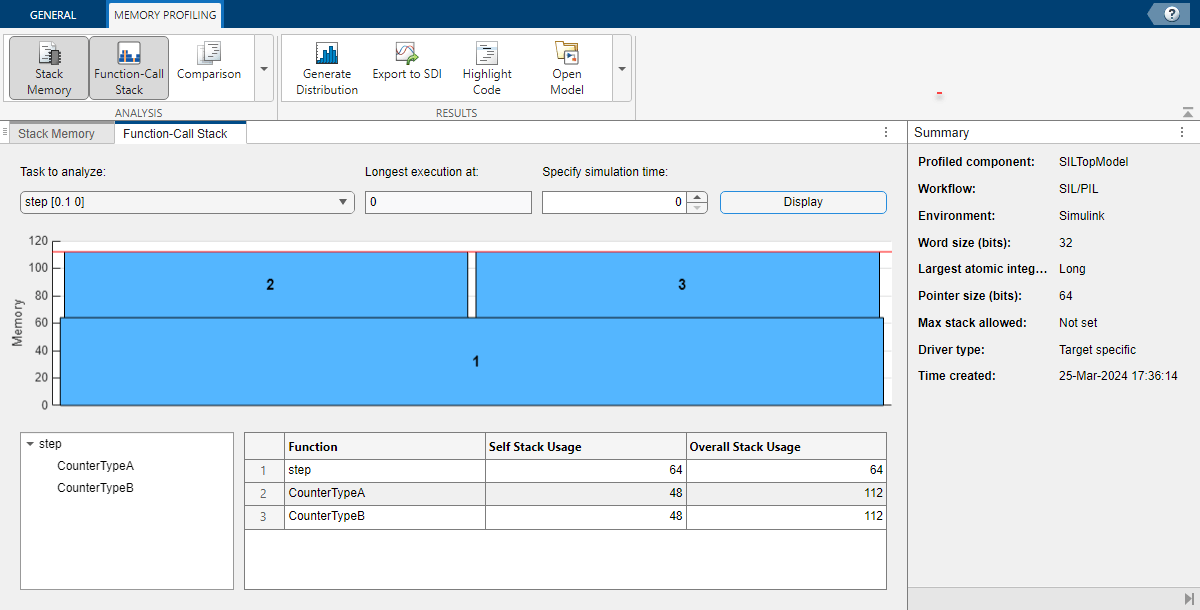
In the Analysis section of the toolstrip, click Function-Call Stack.
On the Function-Call Stack panel, from the Task to analyze drop-down list, select
step [0.1 0].Click Display. The panel displays the function-call stack, which indicates the code or model path for the simulation step.

Automate Stack Usage Analysis of Code Generated from Simulink Models
You can use the coder.profile.test.runTests function to run software-in-the-loop (SIL) or
processor-in-the-loop (PIL) tests of a Simulink model and produce stack usage metrics for the generated code. To view and
analyze the metrics, use the Code Profile Analyzer app.
For more information, see Loop Over Configuration Options During Code Profiling.
See Also
coder.profile.ExecutionStackSet | coder.profile.test.runTests