Delaunay Triangulations Created by delaunay and
delaunayn Functions
The delaunay and delaunayn functions take a set of points and produce a triangulation in matrix
format. Refer to Triangulations for more information on this data structure. In 2-D,
the delaunay function is often used to produce a
triangulation that can be used to plot a surface defined in terms of a set of scattered data
points. In this application, it’s important to note that this approach can only be used if the
surface is single-valued. For example, it could not be used to plot a spherical surface
because there are two z values corresponding to a single
(x, y) coordinate. A simple example demonstrates how
the delaunay function can be used to plot a surface representing a
sampled data set.
MATLAB® provides the delaunayn function to support the creation of
Delaunay triangulations in dimension 4-D and higher. Two complementary functions tsearchn and dsearchn are also provided to support spatial
searching for N-D triangulations. See Nearest-Neighbor Search for more information on
triangulation-based search.
Create 2-D Delaunay Triangulation
This example shows how to use the delaunay function to create a 2-D Delaunay triangulation from the seamount data set. A seamount is an underwater mountain. The data set consists of a set of longitude (x) and latitude (y) locations, and corresponding seamount elevations (z) measured at those coordinates.
Load the seamount data set and view the (x, y) data as a scatter plot.
load seamount
plot(x,y,".",MarkerSize=12)
xlabel("Longitude")
ylabel("Latitude")
grid on

Construct a Delaunay triangulation from this point set and use triplot to plot the triangulation in the existing figure.
tri = delaunay(x,y);
hold on
triplot(tri,x,y)
hold off

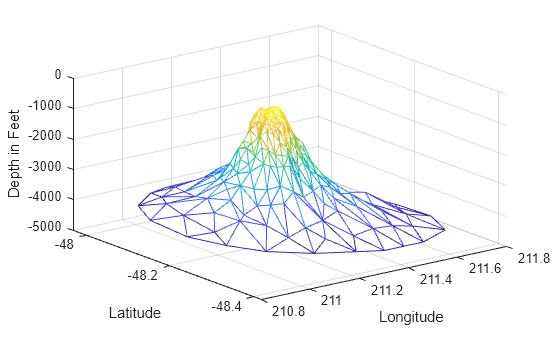
Add the depth data (z) from seamount to lift the vertices and create the surface. Create a new figure and use trimesh to plot the surface in wireframe mode.
figure
hidden on
trimesh(tri,x,y,z)
xlabel("Longitude")
ylabel("Latitude")
zlabel("Depth in Feet")
If you want to plot the surface in shaded mode, use trisurf instead of trimesh.
A 3-D Delaunay triangulation also can be created using the delaunay function. This triangulation is composed of tetrahedra.
Create 3-D Delaunay Triangulation
This example shows how to create a 3-D Delaunay triangulation of a random data set. The triangulation is plotted using tetramesh, and the FaceAlpha option adds transparency to the plot.
rng("default")
X = rand([30 3]);
tet = delaunay(X);
faceColor = [0.6875 0.8750 0.8984];
tetramesh(tet,X,FaceColor=faceColor,FaceAlpha=0.3)