Fill Lookup Tables in a Tradeoff Calibration
Selecting a table node in the tree display enables you to view the models that you have displayed and calibrate that table.
To calibrate the tables, follow these steps.
| Step | |
|---|---|
| 1 | Select the table that you want to calibrate. |
| 2 | Highlight one operating point from the table. |
| 3 | Set the values for other input variables. See Set Values of Variables. |
| 4 | Determine the value of the desired operating point. See Choose a Table Value at a Specific Operating Point. |
| 5 | Click This automatically adds the point to the extrapolation mask. |
| 6 | Repeat the steps to choose values at various operating points. |
| 7 | Extrapolate to fill the table by clicking |
| 8 | Edit table cell values manually by typing values, or right-click to Copy or Paste values. |
The graphs colored green indicate how the highlighted table is filled:
If a row of graphs is highlighted, the table is being filled by the indicated model evaluation (the value shown at the left of the row).
If the column of graphs is green, the table is being filled by the indicated input variable (shown in the edit box below the column).
You can initialize the entire tradeoff to set the tradeoff points for all operating points. In the CAGE tradeoffs view, after you select a tradeoff table, use these settings.
| Goal | Option |
|---|---|
Set all tradeoff points to the table values | Inputs > Initialize from Tables |
Set all tradeoff points to the optimization solution | Either:
In the optimization view, you can select Fill Lookup Tables. |
Clear tradeoff points | Inputs > Clear tradeoff |
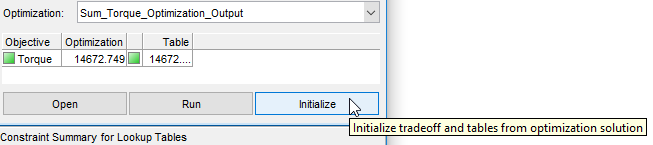
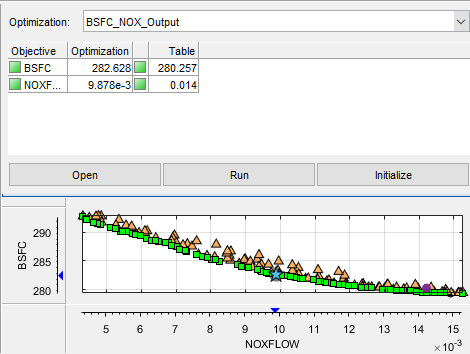
You can select an optimization for comparison with the current table values.
| Goal | Option |
|---|---|
Open the optimization results | Open |
Set the initial values to the table values and rerun the optimization | Run |
Set all tradeoff points to the optimization solution | Initialize |
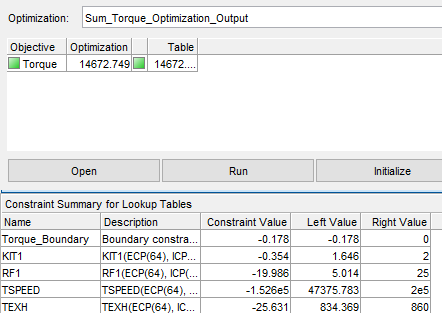
For single objective optimizations, the view includes a summary of constraints evaluated at the lookup table values for the current operating point.
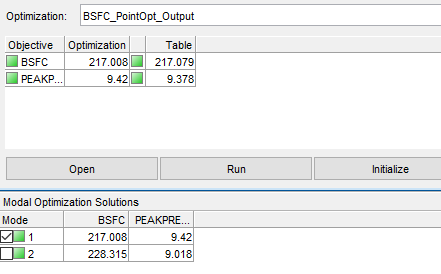
For modal optimizations, you can select the mode.
For multiobjective optimizations, the view includes the Pareto view. The blue start indicates the optimization result.