plotResponse
System object: phased.ShortDipoleAntennaElement
Namespace: phased
Plot response pattern of antenna
Syntax
plotResponse(H,FREQ)

plotResponse(H,FREQ,Name,Value)

hPlot = plotResponse(___)
Description
plotResponse( plots
the element response pattern along the azimuth cut, where the elevation
angle is 0. The operating frequency is specified in H,FREQ)FREQ.
plotResponse(
plots the element response with additional options specified by one
or more H,FREQ,Name,Value)Name,Value pair arguments.
hPlot = plotResponse(___)
Input Arguments
| |
|
Name-Value Arguments
Examples
Specify a short-dipole antenna element with its dipole axis pointing along the z-axis. To do so, set the 'AxisDirection' value to 'Z'.
sSD = phased.ShortDipoleAntennaElement(...
    'FrequencyRange',[100 900]*1e6,'AxisDirection','Z');
Plot the antenna's vertical polarization response at 200 MHz as a 3-D polar plot.
fc = 200e6;
plotResponse(sSD,fc,'Format','Polar',...
    'RespCut','3D','Polarization','V');
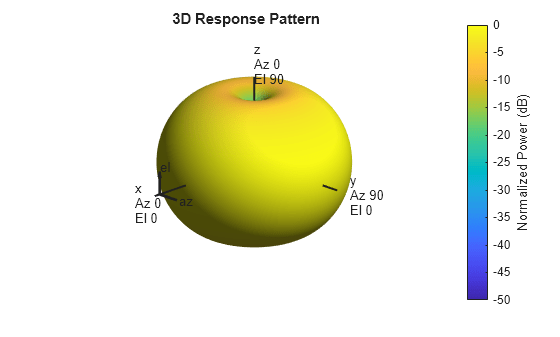
As the above figure shows, the antenna pattern is that of a vertically-oriented dipole and has its maximum at the equator and nulls at the poles.
This example shows how to construct a short-dipole antenna element with its dipole axis pointing along the z-axis and how to plot the response over a selected range of angles. The antenna operating frequency spans the range 100 to 900 MHz.
To construct a z-directed short-dipole antenna, set the 'AxisDirection' value to 'Z'.
sSD = phased.ShortDipoleAntennaElement(...
    'FrequencyRange',[100 900]*1e6,'AxisDirection','Z');
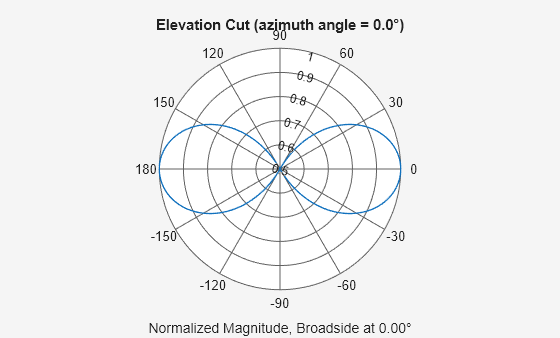
Plot the antenna's vertical polarization response at 200 MHz as an elevation cut at a fixed azimuth angle. Use the 'ElevationAngles' property to restrict the plot from -60 to 60 degrees elevation in 0.1 degree increments.
plotResponse(sSD,200e6,'Format','Polar',...
    'RespCut','El','Polarization','V',...
    'ElevationAngles',[-60:0.1:60],'Unit','mag');
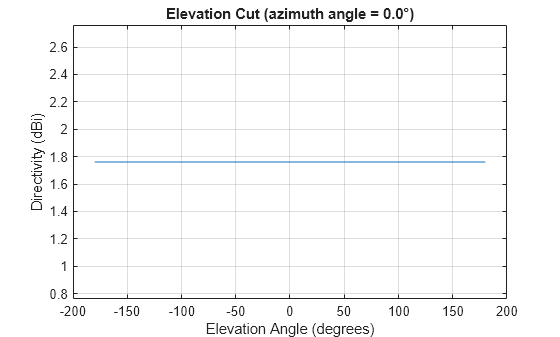
This example shows how to construct a short-dipole antenna element with its dipole axis pointing along the y-axis and how to plot the directivity. The antenna operating frequency spans the range 100 to 900 MHz.
To construct a y-directed short-dipole antenna, set the 'AxisDirection' value to 'Y'.
sSD = phased.ShortDipoleAntennaElement(...
    'FrequencyRange',[100 900]*1e6,'AxisDirection','Y');
Plot the antenna's directivity at 500 MHz as an elevation cut at a fixed azimuth angle.
plotResponse(sSD,500e6,'Format','Line',...
    'RespCut','El','Unit','dbi');