Review Execution Time of Functions in C/C++ Code
R2026bYou can use Polyspace®
Test™ to calculate the metric Execution Time, which computes the time required to execute the different callable entities of your code. See Execution Time.
This topic shows how to open and review the results of execution time calculation. For more information on calculating execution time, see:
Open Execution Time Results
You can open execution time results in the Polyspace Platform user interface or in the Polyspace Access™ web interface:
You can see execution time results after building and running tests in the Polyspace Platform user interface with execution profiling enabled or after calculating execution time using the
polyspace-code-profilercommand.In the Polyspace Platform user interface, once you open execution time results, the Results pane contains an Execution Profiling node. You can right-click this node and open a summary of results in the Dashboard perspective.
For more information, see Open Polyspace Results in Polyspace Platform User Interface.
You can upload execution time results to a Polyspace Access web server, and review the results in a web browser.
In the Polyspace Access web interface, you see results in the Project Explorer pane. You can select an execution time result set to open a summary of results in the Dashboard perspective.
For more information, see Upload Results to Polyspace Access.
You see the same display of execution time results in the Polyspace Platform user interface and the Polyspace Access web interface.
View Execution Time Results on Dashboard
In the Dashboard perspective, you can see a Project Overview dashboard containing an overview of all types of results, and an Execution Profiling dashboard containing more details of execution time results. By default, you see the Project Overview dashboard. Select Execution Profiling on the toolstrip to open the Execution Profiling dashboard.
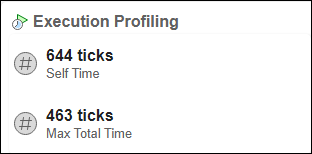
The Project Overview dashboard contains an Execution Profiling section showing execution time metrics such as Self Time and Max Total Time.
The self-time of a function is the time spent in the function during test execution, excluding any time spent in the function callees. The Self Time metric reported on the dashboard is the sum of self-time of all the functions. This metric provides an insight into the time spent in test execution or execution of the
mainfunction if there are no tests.The total-time of a function is the time spent in the function during test execution, including any time spent in the function callees. The Max Total Time metric reported on the dashboard is the total time of the function with the longest value of total time. This metric provides an insight into the time spent in the function where most time is consumed during test execution.
Note that by definition, the self-time of a function is less than the total time spent in the function. However, the Self Time reported at the top of the dashboard is the sum of self-times of all functions and can be greater than the Max Total Time, which is the total time spent in a single function (including time spent in its callees).
The metric values are reported in ticks, where a single tick corresponds to one hundred nanoseconds.
The Execution Profiling dashboard consists of these sections:
Execution Profiling: This section shows the metrics Self Time and Max Total Time that you also see on the Project Overview dashboard.
View by File: This section shows a breakdown of the execution time by file and function. In the rightmost column, the dark bands correspond to the self-time and the light bands correspond to the total time spent in the function (including time spent in callees).
For instance, in the following table, you see that the function
container_resize()has the longest dark band. Therefore, you can see at a glance that most of the time is spent in this function during test execution.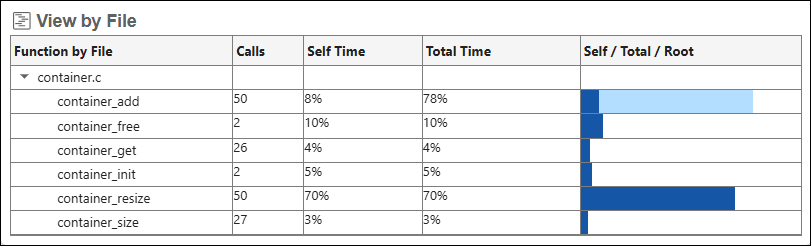
Flame Graph: This section shows a graphical representation of the function call hierarchy. Functions at the same level of the call hierarchy are shown in the same horizontal layer. The width of the bar corresponding to a function is proportional to the total time spent in the function.
For instance, in the following flame graph, all functions except
container_resize()are called directly from tests, therefore, they appear in the first layer of the flame graph. The functioncontainer_resize()is called from another function that is called in the tests, therefore, it appears in the second layer. Of the functions called directly in the tests, the functioncontainer_add()takes up the most time.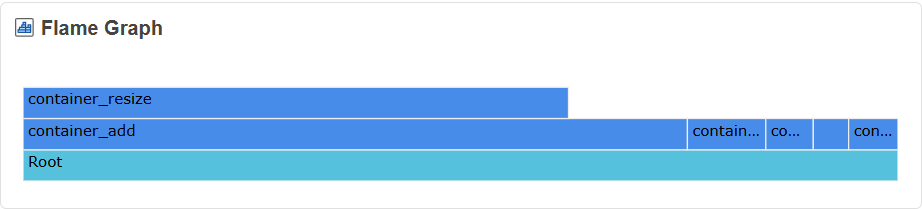
View by Project: In the Polyspace Access web interface, you can also see a dashboard that spans several projects by selecting a parent folder in the Project Explorer pane. To help you distinguish between results from different projects, the Execution Profiling dashboard in Polyspace Access has this additional section that shows a per-project breakdown of the test results.

