Use Synthetic Anomalies to Help Validate Anomaly Detector Models
This example shows how to generate synthetic anomalies that you can use to support the testing and validation of anomaly detector models. Often, historical anomaly data is sparse. Obtaining enough data to rigorously test anomaly detector with real-life data is often a challenge. Synthetic anomalies allow you to augment this data and more thoroughly exercise the detector models you want to validate.
Load Healthy Time Series
Load and plot the healthy single-variable time series channel1.
load HealthySineWaveU channel1
Plot the time series.
plot(channel1)
title("Healthy Time Series")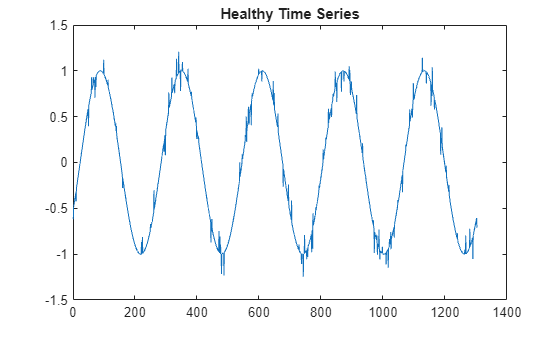
Create and Train Anomaly Detector Model
Create and train a single-channel machine learning detector model. This is the target model for later validation.
Create a single-channel TimeSeriesIForest model using default parameters.
ifmodel = timeSeriesIforestAD(1);
Train the model using channel1 for healthy training data.
ifmodel = train(ifmodel,channel1);
Create and Combine Synthetic Anomaly Models
Create synthetic anomaly models for the "Noise" and "StuckAtConstant anomalies. Specify parameters for both.
noise = syntheticAnomaly("Noise",Type="White",Std=3,Mean = 3.0);
sac = syntheticAnomaly("StuckAtConstant",Type="Custom",Value=1.5);
Combine the models into the vector anomvec.
anomvec = [noise sac];
Inject Anomalies into Time Series
Inject the anomalies into channel1. For example repeatability, specify starting positions for the two anomalies.
[channel1_anom,labels] = injectAnomaly(anomvec,channel1,WindowStart=[185 1080]);
The resulting signal is channel1_anom. The labels output identifies where the anomalies are injected.
ianom = find(labels==1);
ianom(1:8)
ans = 8×1

    185
    186
    187
    188
    189
    190
    191
    192
plot(channel1_anom)
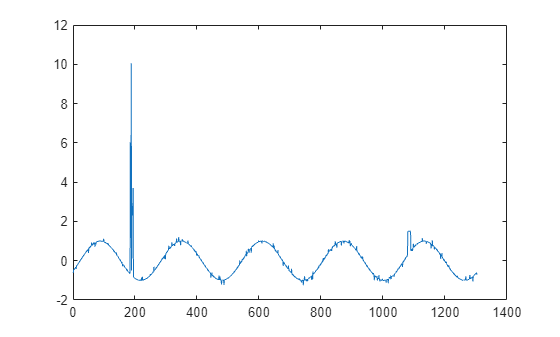
The anomalies appear where WindowStart specifies.
Test Anomaly Detector
Use detect to test whether ifmodel can detect the synthetic anomalies.
resultsif = detect(ifmodel,channel1_anom);
plot(ifmodel,channel1_anom)
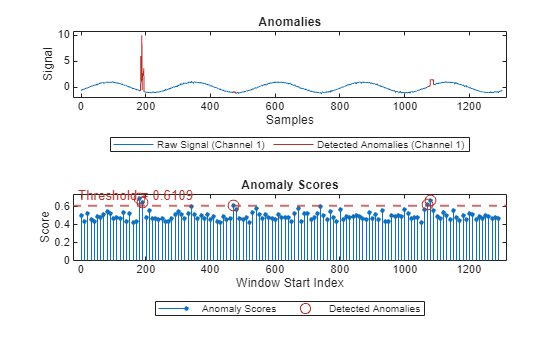
For this case, ifmodel successfully detected both anomalies.
See Also
syntheticAnomaly | injectAnomaly