Modelscape Monitor
Modelscape™ Monitor™ is part of Modelscape, a fully-customizable platform for regulation-compliant model risk management and model deployment at scale. Use Modelscape to move your financial models into production faster while reducing costs, increasing automation, and ensuring regulatory-compliance with frameworks such as SS 1/23, SR 11-7, OSFI E-23, and ECB TRIM.
Use Modelscape Monitor to track the performance of your financial models with centralized access to model performance criteria, model health statuses and associated automated actions. Perform these tasks:
View and visualize model monitoring metrics such as data drift and fairness
Create and configure custom metrics and visualizations
Build and automatically deploy custom dashboards
Monitor model use, performance, and status across the model lifecycle
View Monitoring Status
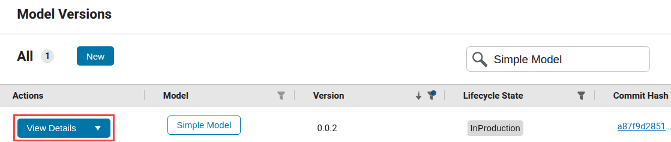
This example shows how to view the Monitoring Status of a model deployment in Modelscape. Navigate to the Model Versions page and find your required model version using the search and filter tool. Then click View Details.
This opens the model version details page. Find the monitoring status at the bottom of the page.
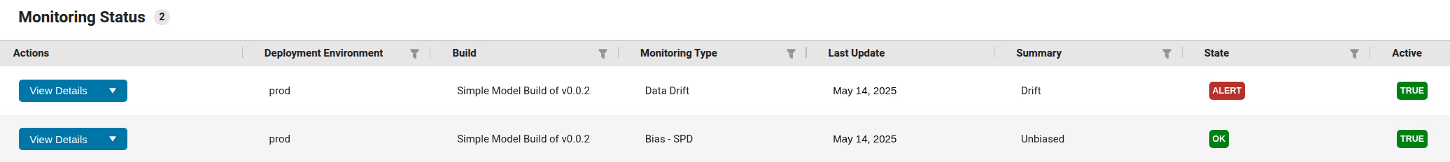
See that the production deployment of the model shows monitoring status with respect to
two monitoring types: data drift and statistical parity difference (SPD). The table shows
that the deployment is in an OK state with respect to SPD, but it is in
Alert state for data drift. The right-hand column titled
Active indicates that the model is actively monitored for these two
monitoring types.
Start investigating the drift status by setting the state for data drift to
Under Investigation. Click the drop-down arrow in the Actions column, then click Set to 'Under
Investigation'.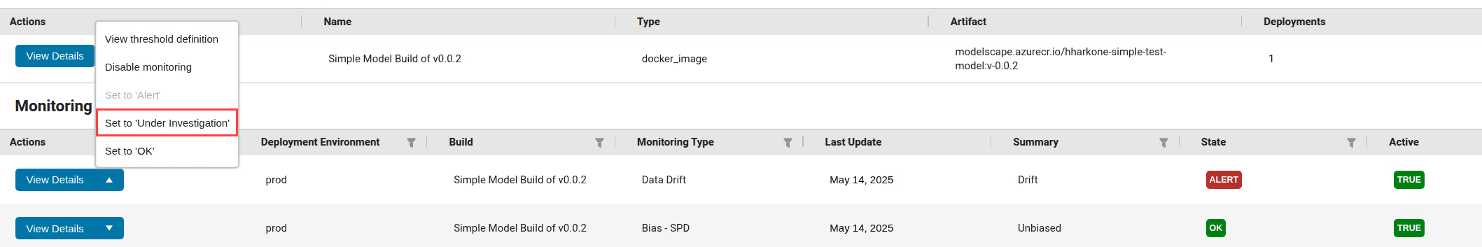
You see the state label is now Under Investigation.
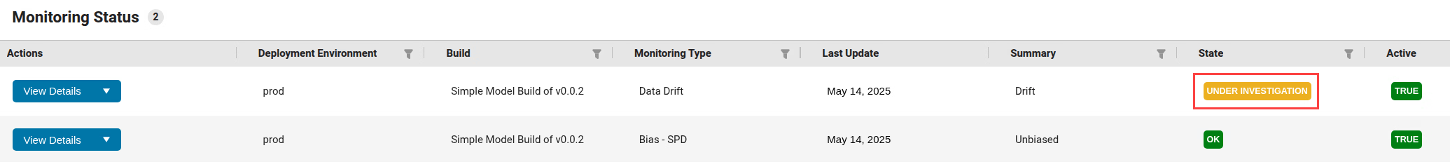
Modelscape supports automated actions to, for example, send an email alert to model owners in informing them of the change in state. To find further information about the data drift monitoring, click View Details. This takes you to the Monitoring Evaluations page.
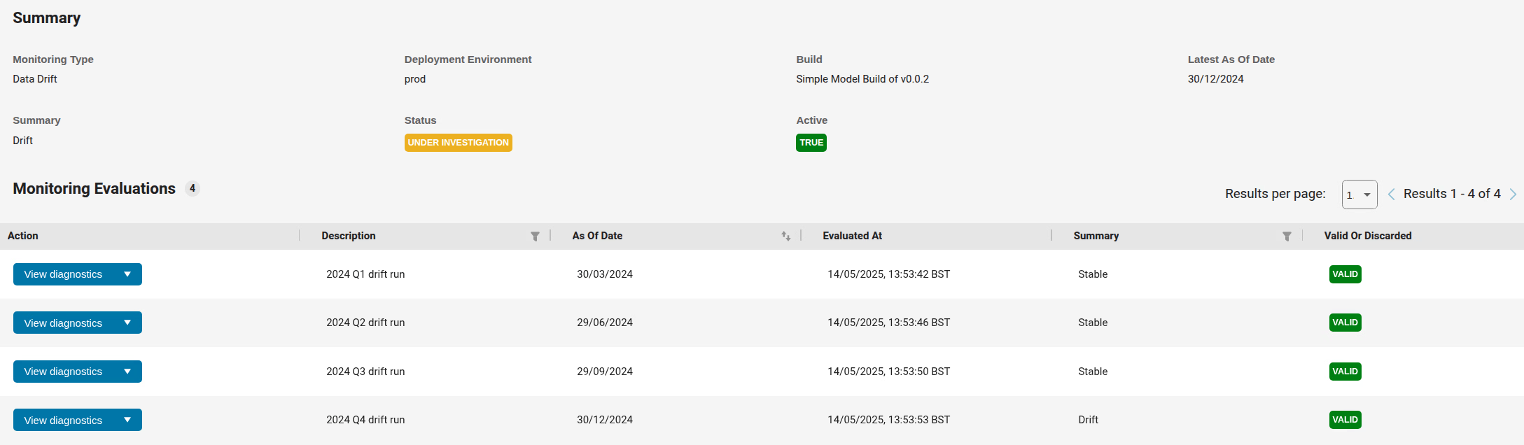
The top half of the page summarizes the current Monitoring Status of this deployment for data drift. The bottom half shows all data drift monitoring evaluations recorded in the system. Values in the columns Description and the As Of Date indicate that the four runs shown are the quarter-end drift monitoring runs for 2024. Values in the Evaluated At column show that the monitoring runs do not necessarily take place on the As Of Date. By default, the table shows the complete history of monitoring evaluations, including runs whose results were discarded due to operational or other issues. To show only valid monitoring runs, use the filter in the final column.
You see from the Summary column that the model was found to be Stable
for the first three quarters of 2024, but is in a drifted state for the fourth quarter. To
see more information about this run in the fourth quarter, click View
Diagnostics. This opens the page with Monitoring Diagnostics.
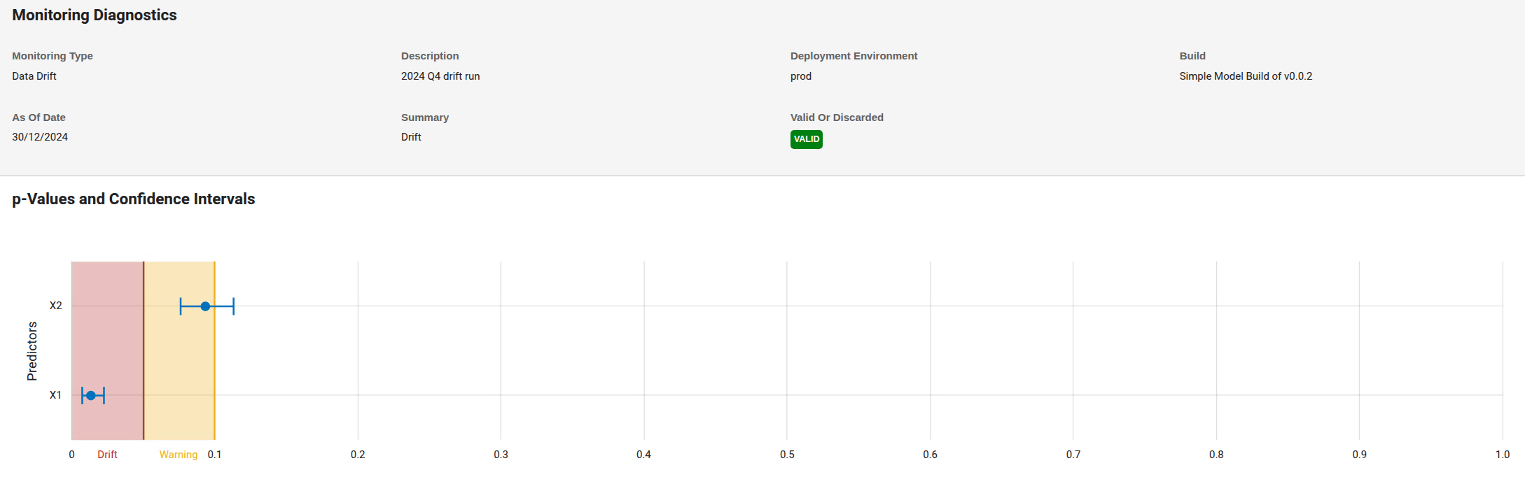
The page shows information about the drift computed using the detectdrift function. The chart shows
that the drift threshold for this model has been set to 0.05 and the
warning threshold to 0.1. You see that variable X1 is
in a drift state. The corresponding p-value is so low that the overall drift status,
calculated using the Bonferroni method, is Drift.
To see predictor-specific information about the drift, select the variable using the
drop down in the middle of the page and see the charts further down the page. Here,
Baseline means the data on which the model version was trained and
Target refers to the production data used in a given window, for
example during the preceding month. For details about the plots, see the detectdrift documentation.
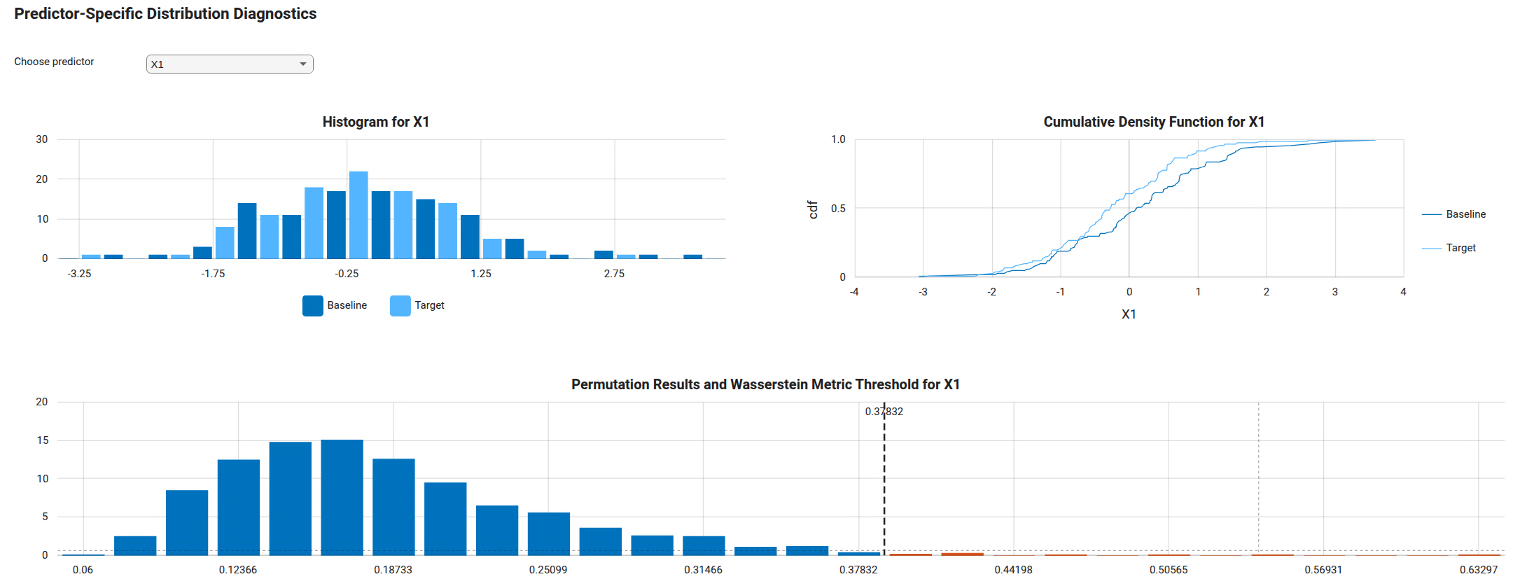
You see that the distribution of X1 data has shifted towards low negative values. Conduct appropriate checks to decide whether the model performance is acceptable with the current inputs. If so, change the state of the data drift Monitoring Status to OK as shown above. If not, consider creating a new model version with augmented training data or other improvements to preserve the model performance.