Group Delay and Phase Delay
By definition, the group delay of a filter is the negative first derivative of the filter phase response. If is the complex-valued frequency response of a filter and is the continuous (unwrapped) phase of , then the group delay is
.
The phase delay of a filter is the negative of the phase divided by the frequency:
.
FIR Filters
The complex frequency response of a symmetric linear-phase FIR filter of order can be expressed as , where is a real-valued amplitude. For this type of filter, the group delay is , which is constant over the entire frequency range. However, the phase delay is constant only at the lowest frequencies where is positive.
Verify that a fourth-order FIR filter with a symmetric vector of coefficients has linear phase.
fs = 2000;
fc = 200;
N = 4;
b = fir1(N,fc/(fs/2));
islinphase(b,1)
ans = logical
   1
Use the grpdelay function to compute group delay of a filter. The group delay is one-half the filter order.
grpdelay(b,1,[],fs)
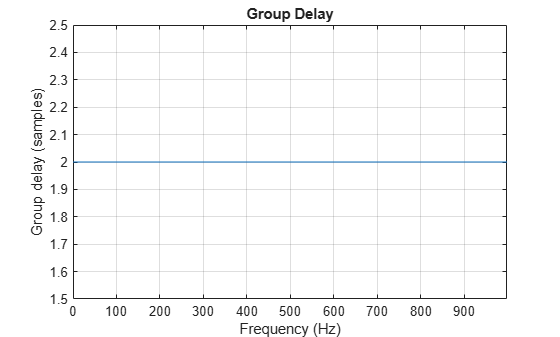
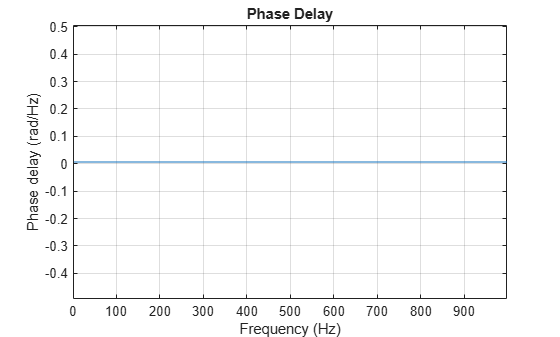
Use the phasedelay function to compute the phase delay of a filter. For this linear-phase FIR filter, the phase delay and group delay are constant over the entire frequency range.
phasedelay(b,1,[],fs)
IIR Filters
A filter has a linear phase if its frequency response can be expressed as , where is a constant. Stable IIR filters do not have linear phase because their frequency responses cannot be expressed that way.
Verify that a fourth-order Butterworth lowpass filter does not have linear phase.
[b,a] = butter(N,fc/(fs/2));
islinphase(b,a)
ans = logical
   0
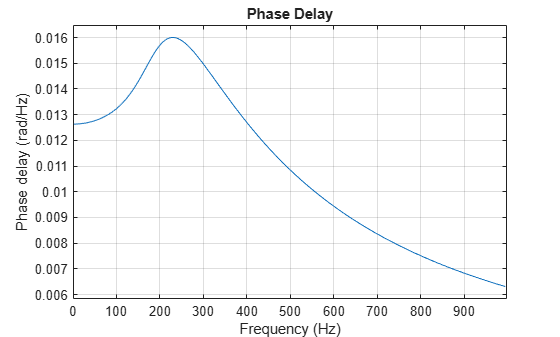
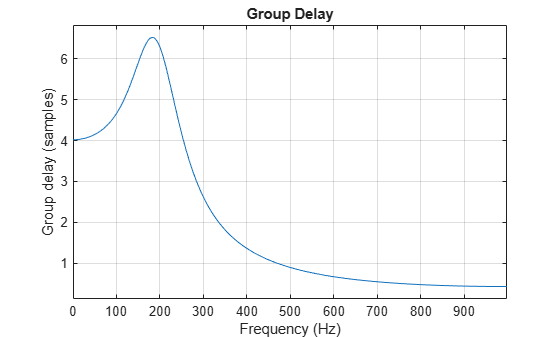
Plot the group delay and the phase delay of the Butterworth lowpass filter. Since IIR filters lack linear phase, the group delay and phase delay are not constant over frequency. The maxima in the group delay and phase delay plots are located around the filter cutoff frequency.
grpdelay(b,a,[],fs)
phasedelay(b,a,[],fs)