Execution Profiling for Real-Time Applications
R2026bThis example shows how to profile task execution time and function execution time for a multirate real-time application running on a multicore Speedgoat® target computer. Profiling helps you verify that tasks complete within their allocated time budgets and identify potential CPU overruns before they cause failures in production.
In this example, a model with multiple referenced subsystems is partitioned across processor cores. You collect profiling data to measure how long each task and function takes to execute, then download the results for analysis.
To profile the real-time application:
Build and deploy the multirate model to the target computer.
Start the profiler and run the application to collect execution timing data.
Download the profiler data as a
.perffile for offline analysis.
Generate Real-Time Application Execution Profile
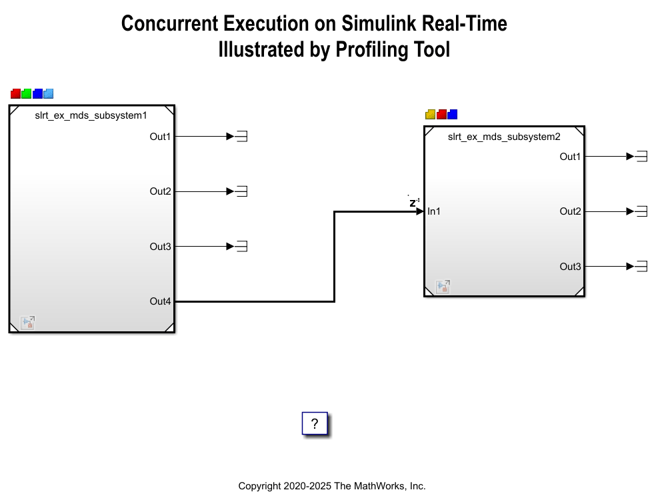
Generate profile data for model slrt_ex_mds_and_tasks on a multicore target computer.
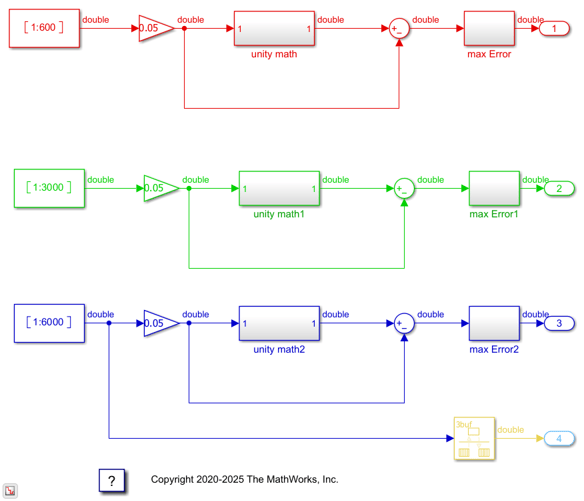
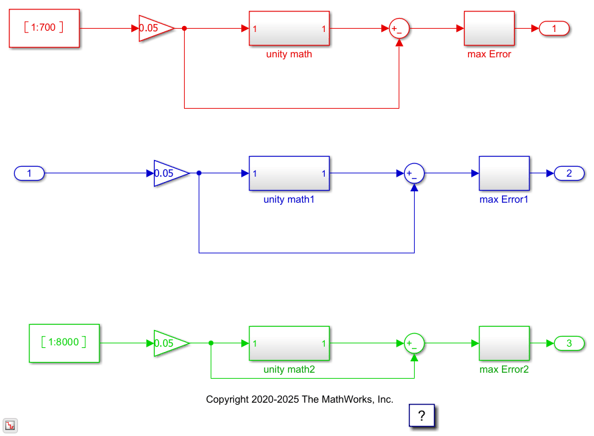
1. Open, build, and download the model.
tg = slrealtime;
connect(tg);
model = 'slrt_ex_mds_and_tasks';
open_system(model);
modelSTF = getSTFName(tg);
set_param(model,"SystemTargetFile",modelSTF);
open_system('slrt_ex_mds_subsystem1');
set_param('slrt_ex_mds_subsystem1',"SystemTargetFile",modelSTF);
open_system('slrt_ex_mds_subsystem2');
set_param('slrt_ex_mds_subsystem2',"SystemTargetFile",modelSTF);
evalc('slbuild(model)');
load(tg,model);
setStopTime(tg,20);
2. Start the profiler, then start the real-time application.
startProfiler(tg);
start(tg);
pause(5);
stopProfiler(tg);
stop(tg);
3. Download the profiler data.
getProfilerData(tg,model,"slrt_ex_mds_and_tasks_profiler_data");
Processing data on target computer ...
The function downloads the raw profiler data from the target computer and saves it as a .perf file in the current working folder. The .perf file is in Linux perf format and can be analyzed with standard Linux perf tools. The .perf file contains sampled performance data, including call stacks and function samples. You can process this data to visualize execution profiles, determine which functions consume the most execution time, analyze call stacks, and identify CPU hotspots.
bdclose(model);
bdclose('slrt_ex_mds_subsystem1');
bdclose('slrt_ex_mds_subsystem2');
See Also
stopProfiler | startProfiler | resetProfiler | getProfilerData | getAvailableProfile | deleteProfilerData

