Stateflow Editor
Construct Stateflow charts
Description
Use the Stateflow Editor tool to create Stateflow® charts. Build states and transitions with the object palette, manage data in the Symbols pane, and modify objects in the Property Inspector. Tab suggestions help you complete syntax, and color settings highlight changes. Navigate your diagrams with the map and zoom tools to move around.
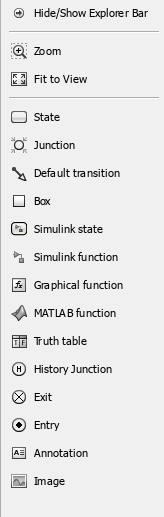
Object Palette
The object palette lists the graphical objects you can use on the Stateflow canvas. Click the name or icon of the graphical object, then click the location on the canvas to place the object. You can right-click the object palette to show or hide the object names.
Open the Stateflow Editor
To open the Stateflow Editor, double-click a Chart block in your Simulink® model.
Examples
Stateflow tab completion provides context-sensitive editing assistance to help you avoid typographical errors. Use tab completion to quickly select syntax-appropriate options for keywords, data, events, messages, and function names. To complete entries in a Stateflow chart:
Type the first few characters of the syntax that you want to enter.
Press Tab to see the list of possible matches.
Use the arrow keys to select a word.
Press Tab to make the selection.
Additionally, you can:
Close the list without selecting anything by pressing the Esc key.
Type additional characters to narrow the list of possible matches.
If you press Tab and no words appear, then the current word is the only possible match.
Select the graphical objects that you want to align, distribute, or resize. You can select graphical objects in any order, one-by-one, or by clicking and dragging the canvas to draw a box around them.
Decide which object to use as the anchor. This object is the reference object.
To set an graphical object as the reference, right-click the object. Brackets appear around the reference object. In this example, the
DoorandMotionstates are selected, and theDoorstate is the reference. If you select objects one-by-one, the last object that you select is the reference.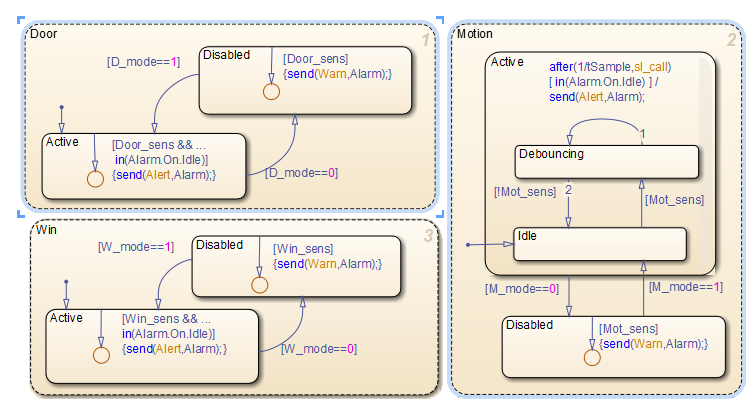
In the Format tab select an option to align, distribute, or resize your chosen objects.
| Option | Description |
|---|---|
| Distribute Horizontally | Distribute the graphical objects so that the center-to-center horizontal distance between any two objects is the same. The horizontal space is the distance between the left edge of the leftmost object and the right edge of the rightmost object. If the total width of the objects you select exceeds the horizontal space available, objects can overlap after distribution. |
| Distribute Vertically | Distribute the graphical objects so that the center-to-center vertical distance between any two objects is the same. The vertical space is the distance between the top edge of the highest object and the bottom edge of the lowest object. If the total height of the objects you select exceeds the vertical space available, objects can overlap after distribution. |
| Even Horizontal Gaps | Distribute the graphical objects so that the horizontal white space between any two objects is the same. The space restriction for Distribute Horizontally applies. |
| Even Vertical Gaps | Distribute the graphical objects so that the vertical white space between any two objects is the same. The space restriction for Distribute Vertically applies. |
You can change the way Stateflow displays individual elements in a chart or specify the display options to use for the entire chart.
To change the display settings for a single element in the chart, right-click the element,click Format, and select an option from the context menu. The options available depend on the element that you select.
To change the display options for the entire chart, follow these steps:
Specify a color scheme and label fonts for different types of objects in a chart with the Colors & Fonts dialog box. To open the Colors & Fonts dialog box, in the Format tab, click Style.
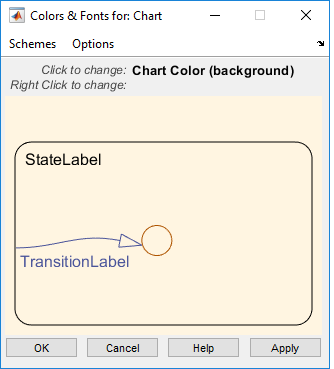
Choose a different color scheme from the Schemes menu. To modify the display options for a single type of chart element, point to the sample object.
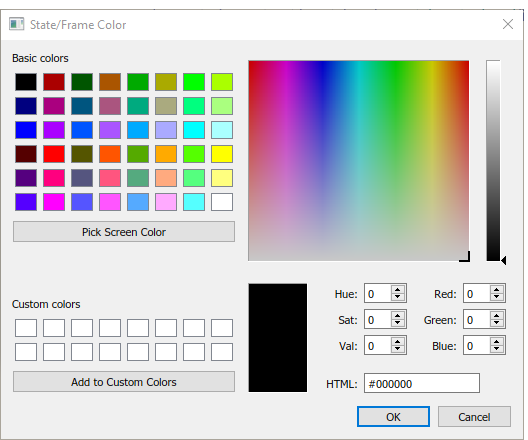
To change the color of the element, click the sample object and select a new color in the dialog box.
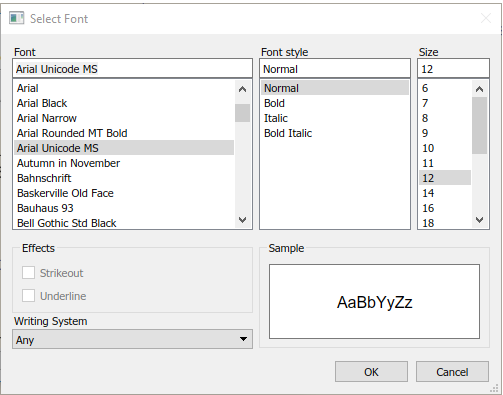
To change the font of the element, right-click the sample object and select a new font, style, or size in the dialog box.
To apply the scheme to the chart, click Apply. To apply the scheme and close the dialog box, click OK.
To make the scheme the default scheme for all charts, select Options > Make this the 'Default' scheme.
To save changes to the default color scheme, select Options > Save defaults to disk. If the modified scheme is not the default scheme, choosing Save defaults to disk has no effect.
In the Simulink canvas, you can preview the content of Stateflow charts. From the Stateflow canvas, you can preview the content of subcharts and Simulink functions.
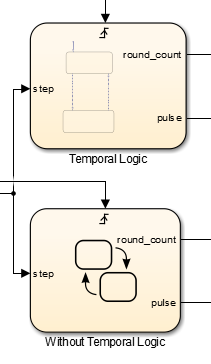
To turn on content preview for Stateflow charts and subcharts, right-click the chart
and select Format > Content Preview. For example, in this image, the Temporal Logic chart
displays a content preview.. The chart Without Temporal Logic does
not.
You can use color highlighting to differentiate these syntax elements:
Keywords
Comments
Events
Messages
Functions
Strings
Numbers
Local data
Constant data
Input data
Output data
Parameter data
Data Store Memory data
Syntax highlighting is a user preference, not a model preference.
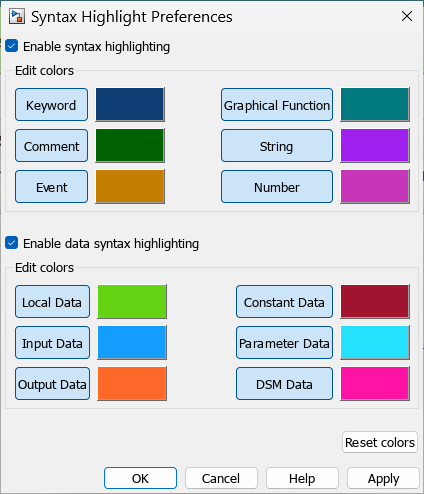
In the Format tab, click Style > Syntax Highlighting. The Syntax Highlight Preferences dialog box appears.
To reset highlighting colors to their default, select Reset Colors, and click Apply. Alternatively, you can reset the default colors with
Stateflow.resetSyntaxHighlightingColors.To disable or enable highlighting, select or clear Enable syntax highlighting.
To change a color, in the Syntax Highlight Preferences dialog box, select a color to change. Choose an alternative from the color palette, and click Apply.
To close the Syntax Highlight Preferences dialog box, click OK.
Related Examples
Version History
Introduced before R2006a
See Also
Property Inspector (Simulink)