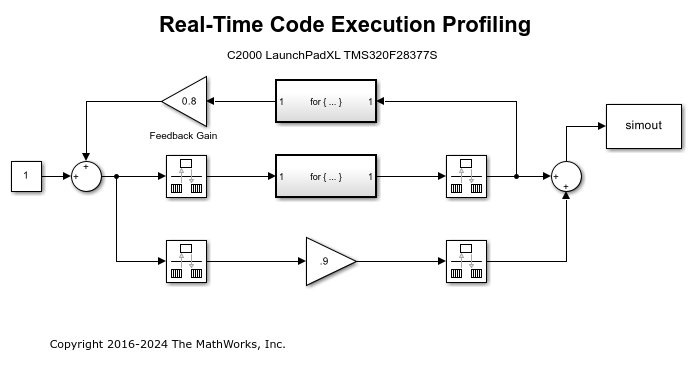
Real-Time Code Execution Profiling
This example shows you how to use C2000™ Microcontroller Blockset for real-time execution profiling of generated code.
Available Versions of This Model:
C2000 LaunchPadXL TMS320F28377S (LAUNCHXL-F28377S):
f28377S_RTProfiler.slx
Model
Open the f28377S_RTProfiler.slx example model.

Introduction
Sample times specified in a Simulink® model determine the time schedule for running generated code on target hardware. If the target hardware has sufficient computing power, the code runs according to specified sample times in real-time.
You can use real-time execution profiling to check whether generated code meets real-time performance requirements. Execution Profiling results can also be used to take actions to enhance design of your system. For example, if the code easily meets the real-time requirements, you may consider adding more functionality to your system to exploit available processing power. If, on the other hand, the code does not meet real-time requirements, you may look for ways to reduce execution time. For example, you can identify the tasks that require the most time and then investigate whether trade-off between functionality and speed is possible.
This example introduces a workflow for real-time code execution profiling by showing you how to:
Configure the model for code execution profiling, and generate code.
Run generated code on target hardware.
Analyze performance through code execution profiling plots and reports.
To Run the Example on the Board
1. Open the f28377S_RTProfiler.slx model. This model is configured for C2000 LaunchPadXL TMS320F28377S (LAUNCHXL-F28377S) target hardware.
2. Open the Modeling tab and click Model Settings or press Ctrl+E to open Configuration Parameters dialog box. Go to Code Generation > Verification.
3. Select Measure task execution time, and select Measure function execution times > Detailed (all function call sites) option. These options enable you to profile execution time for each task and function in generated code. Click OK.
4. Check that Hardware Implementation > Build Options > Build, load and run is selected. This option must be selected, or the generated executable does not download into the target.
5. Set the number of profiling samples to be collected on the target using this command.
codertarget.tic2000.setExecutionProfileBufferLength(<modelName>, 100)
6. Open the Hardware tab and click Build, Deploy & Start to run the code inside the target hardware.
7. Run the following code in MATLAB® Command Window to get the profiling data into MATLAB workspace:
codertarget.profile.getData('f28377S_RTProfiler')The variable executionProfile is available in the MATLAB workspace at the end of execution of this command.
8. Run the following code in MATLAB Command Window to obtain the Profiling Report for the session you just ran. Analyze the report on different turnaround and execution times for each task and function. Close the report when you are done.
executionProfile.report

9. Execute the following code in MATLAB Command Window to visualize the scheduling of different tasks and functions. Notice where the faster task pre-empts the slower one and where different functions start and end.
executionProfile.schedule
Notes
The code execution profiler uses an on-chip timer. If you use a processor simulator, select one that can simulate processor timers.
The model needs to run long enough to collect sufficient profiling data. This time depends on the number of profiling samples specified and the sample rates of the model. If you use a simulator, data collection can take considerably longer than when you use hardware.
Number of profiling samples to collect refers to the max number of buffers allocated to store the profiling data. This does not mean that the total number of function calls will be equal to the number of profiling samples to collect. For more information, see
schedule(Embedded Coder).
P indicates that the task was pre-empted.
The shipped target configuration file (ccxml) removes RAM initializations done by the debugger while connecting to the target. Please make sure of this behavior on using a custom target configuration file.
For asynchronously executed subsystems, code execution profiling is supported only for Hardware Interrupt and Idle Task blocks.
Profiling probe functions add the finite amount of time in actual execution time.
Once the profiling data is extracted, the execution will stop running in the hardware. You need to power cycle the board or flash the software from simulink to get it running.
During profiling, timer0 is configured after the model performs all the initializations. So there is a delay in 1 step size as the timer is not triggered at t=0.