Résultats pour
Write a matlab script that will print the odd numbers, 1 through 20, in reverse.
I cannot figure out how to do this correctly, please help.
I think it would be a really great feature to be able to add an Alpha property to the basic "Line" class in MATLAB plots. I know that I have previously had to resort to using Patch to be able to plot semitransparent lines, but there are also so many other functions that rely on the "Line" class.
For example, if you want to make a scatter plot from a table with things specified into groups, you can use ScatterHistogram or gscatter but since gscatter uses the Line class, you can't adjust the marker transparency. So if you don't want the histograms, you are stuck with manually separating it and using scatter with hold on.
The title is resonably non-descript, but I can explain it easily:
Say I have an initial Emax model:
v = emax1*[G]^n1/(ec501^n1+[G]^n1)
And I want to place v inside of a second Emax model:
y = emax2*v^n2/(ex502^n2+v^n2)
Currently, I have the full function of v inside y, twice, it's very long and whilst I only need to get it correct once, for readability in the future I'd rather have it in form #2. I've played around with non-constant parameters but I need the steady state to be v, not the rate rule, and I haven't worked out how to make a parameter shift to a form like v, as an observation might.
Are there any recommended solutions or do I simply need to keep with having v fully expressed in y?
Thank you,
Dan
I saw this post on Answers.
I was impressed at the capability of the AI, as I have been at other times when I posed a question to it, at least some of the time. So much so that I wondered...
What if the AI were automatically applied to EVERY question on Answers? Would that be a good or bad thing? For example, suppose the AI automatically offers an answer to every question as soon as it gets posted? Of course, users would still be allowed to post their own, possibly better answers. But would it tend to disincentivise individuals from ansering questions?
Perhaps as bad, would it push Answers into the mode of a homework solving forum? Since if every homework question gets a possibly pretty good automatic AI generated solution, then every student will just post all HW questions, and the forum would quickly become overwhelmed.
I suppose one idea could be to set up the AI to post an answer to all un-answered questions that are at least one month old. Then students would not gain by posting their homework.
Hi Guys
Posting this based on a thought I had, so I don't really ahve any code however I would like to know if the thought process is correct and/or relatively accurate.
Consider a simple spring mass system which only allows compression on the spring however when there is tension the mass should move without the effect of the spring distrupting it, thus the mass is just thrown vertically upwards.
The idea which I came up with for such a system is to have two sets of dfferential equations, one which represents the spring system and another which presents a mass in motion without the effects of the spring.
Please refer to the below basic outline of the code which I am proposing. I believe that this may produce relatively decent results. The code essentially checks if there is tension in the system if there is it then takes the last values from the spring mass differential equation and uses it as initial conditions for the differential equation with the mass moving wothout the effects of the spring, this process works in reverse also. The error which would exist is that the initial conditions applied to the system would include effects of the spring. Would there be a better way to code such behaviour?
function xp = statespace(t,x,f,c,k,m)
if (k*x(1)) positive #implying tension
**Use last time step as initial conditions**
**differential equation of a mass moving""
end
if x(1) negative #implying that the mass in now moving down therefore compression in spring
**Use last time step as initial conditions**
**differential equation for a spring mass system**
end
end
Seeing a colleague make this mistake (one I've had to fix multiple times in other's work too) makes me want to ask the community: would you like the awgn() function/blocks to give the option for creating a SNR at the bandwidth of the signal? Your typical flow is something like this:
- Create a signal, usually at some nominal upsampling factor (e.g., 4) such that it's now nicely over sampled, especially if you're using a RRC or similar pulse shaping filter.
- Potentially add a frequency offset (which might make the sample frequency even higher)
- Add AWGN channel model for a desired SNR
- Put this into your detector/receiver model
The problem is, when someone says, "I'm detecting XYZ at foo SNR," it should not magically improve as a function of the oversample. The problem isn't that awgn() generates white noise, that's what it's supposed to do and the typical receiver has noise across the entire band. The problem is that SNR is most properly defined as the signal power over the noise power spectral density times the signal's noise equivalent bandwidth. Now I looked and there's no handy function for computing NEBW for an input signal (there's just a function for assessing analysis windows). In practice it can get a bit tricky. The occupied bandwidth or HPBW are often close enough to the NEBW, we're usually not haggling over hundredths of a dB. So, in my not so humble opinion, the "measured" flag for awgn() should give an option for bandwidth matching or at least document the behavior better in the help page. All too often I'm seeing 3-6 (or worse) dB errors because people aren't taking the signal's bandwidth into account.
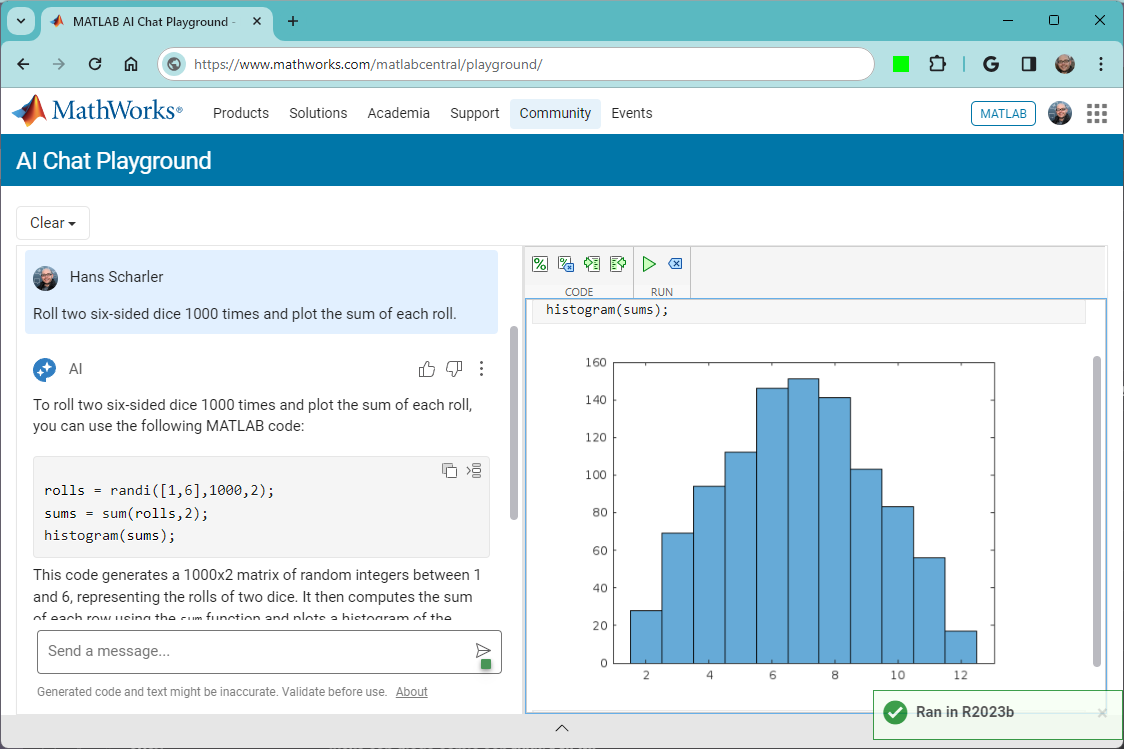
The MATLAB AI Chat Playground is open to everyone!
Check it out here on the community: https://www.mathworks.com/matlabcentral/playground
Hi All,
I'm currently attempting to implement a Hodgkin-Huxley-type model of membrane potential, ideally I would like a species that represents the membrane potential as its own distinct entity, so as the reference elsewhere. I've currently established a molarity-based work around but it would be great if I could set the units for the species as millivolt, but that throws an error.
Is there an established way to do this? I imagine I'm not the first person to be trying to model a voltage-gated ion channel!
Thank you for your help.
Hello,
I've looked around and I haven't found anything obvious about this, but is it possible to link to species/reactions, graphically, in a non-mass transfer sense? I have areas in my model where it would conceptually make sense to be able to see that species or reactions are linked, but if I link them in the standard way it demands that it be involved in the stoichiometry.
Perhaps some kind of dotted line, or similar?
Thank you, best regards,
Dan
I know the latest version of MATLAB R2023b has this feature already, put it should be added to R2023a as well because of its simplicity and convenience.
Basically, I want to make a bar graph that lets me name each column in a basic bar graph:
y=[100 99 100 200 200 300 500 800 1000];
x=["0-4" "5-17" "18-29" "30-39" "40-49" "50-64" "65-74" "75-84" "85+"];
bar(x,y)
However, in R2023a, this isn't a feature. I think it should be added because it helps to present data and ideas more clearly and professionally, which is the purpose of a graph to begin with.
Would it be a good thing to have implicit expansion enabled for cat(), horzcat(), vertcat()? There are often situations where I would like to be able to do things like this:
x=[10;20;30;40];
y=[11;12;13;14];
z=cat(3, 0,1,2);
C=[x,y,z]
with the result,
C(:,:,1) =
10 11 0
20 12 0
30 13 0
40 14 0
C(:,:,2) =
10 11 1
20 12 1
30 13 1
40 14 1
C(:,:,3) =
10 11 2
20 12 2
30 13 2
40 14 2
In the past year, we've witnessed an exponential growth of ChatGPT and other Generative AI tools. AI has quickly become a transformative force across industries, from tech giants to small startups, and even community sites like ours. For instance, Stack Overflow announced its plan to leverage AI tools to draft a question or tag content; Quora built a ChatGPT bot to answer questions; and GitHub is piloting the AI tool for personalized content.

This trend in the community landscape makes me wonder what MATLAB Central community, especially in MATLAB Answers, can do to integrate AI and enhance the community.
Share with us your ideas in the comment session. Ideally one comment per idea, so that others can vote on a secific idea or have deeper discussions about it.
We launched the Discussions area with 6 channels, based on the existing types of content we see today in the MATLAB Central community.
I'm curious which channels you are most interested in participating, or which channels are missing.
Tell us your thoughts here!
Hello all,
I've been trying to shift my workflow more towards simbiology, it has a lot of very interesting features and it makes sense to try and do everything in one place if it works well..! Part of my hesitancy into this was some bad experiences handling units in the past, though this was almost certainly all out of my own ignorance, relatedly:
Getting onto my question.
In this model I have a species traveling around the body via blow flow, think a basic PBPK model. My species are picomolarities, if everything is already in concentrations, why is it necessary to initially divide by the compartment volume? i.e. 1/Pancreas below.

If my model dealt in molar quantities this would make a lot of sense, the division would represent the transition to concentrations. This, however, now necessitates my parameters be in units of liter/minute, which is actually correct, but I'd like clarification on why it's correct, ha!
Perhaps this is more of a modelling question than a simbiology question, but if there are answers I'd love to hear them. Thanks!
Hi All,
I'm attempting to put a set of simbiology global sensitivity analysis plots into my thesis and I'm running into some issues with the GSA plots. Firstly, the figures are very large, it would be quite beneficial to grab a set of the plots and arrange them myself, is there any documentation on how to mess around with the '1x1 Sobol' produced by sbiosobol? Or just GSA plots in general.
The second problem is that the results appear to be relative to the most sensitive parameter in that run. Is it recommended to have a resonably sensitive 'baseline' parameter in each run? I find it difficult to compare plots when a not so sensitive parameter is being recorded as near '1' for the whole run because it's being stacked against a set of very insensitive parameters. I.e. if i have multiple sets of GSAs due to a large model, how can I easily compare results? If I could do some single run through with every parameter that would be the ideal, I imagine, but then the default plot would be half a mile off the bottom of my screen, haha! Perhaps there is a solution to the first question that might help there?
Thank you for your help,
Dan
Thats the task:
Given a square cell array:
x = {'01', '56'; '234', '789'};
return a single character array:
y = '0123456789'
I wrote a code that passes Test 1 and 2 and one that passes Test 3 but I'm searching a condition so that the code for Test 3 runs when the cell array only contains letters and the one for Test 1 and 2 in every other case. Can somebody help me?
This is my code:
y = []
[a,b]=size(x)
%%TEST 3
delimiter=zeros(1,a)
delimiter(end)=1
delimiter=repmat(delimiter,1,b)
delimiter(end)=''
delimiter=string(delimiter)
y=[]
for i=1:a*b
y = string([y x(i)])
end
y=join(y,delimiter)
y=erase(y,'0')
y=regexprep(y,'1',' ')
%%TEST 1+2
for i=1:a*b
y = string([y x(i)])
y=join(y)
end
y=erase(y,' ' )
That's the question: Given four different positive numbers, a, b, c and d, provided in increasing order: a < b < c < d, find if any three of them comprise sides of a right-angled triangle. Return true if they do, otherwise return false .
I wrote this code but it doesn't pass test 7. I don't really understand why it isn't working. Can somebody help me?
function flag = isTherePythagoreanTriple(a, b, c, d)
a2=a^2
b2=b^2
c2=c^2
d2=d^2
format shortG
if a2+b2==c2
flag=true
else if a2+b2==d2
flag=true
else if a2+c2==d2
flag=true
else if c2+b2==d2
flag=true
else flag=false
end
end
end
end
end
That's the question:
The file cars.mat contains a table named cars with variables Model, MPG, Horsepower, Weight, and Acceleration for several classic cars.
Load the MAT-file. Given an integer N, calculate the output variable mpg.
Output mpg should contain the MPG of the top N lightest cars (by Weight) in a column vector.
I wrote this code and the resulting column vector has the right values but it doesn't pass the tests. What's wrong?
function mpg = sort_cars(N)
load cars.mat
sorted=sortrows(cars,4)
mpg = sorted(1:N,2)
end
Hi all,
I've translated a model from another piece of software (monolix) into simbio programmatically to make use of your very easy global sensitivity analysis system.
It looks a little something like this, for a 'single' line example:
r1 = addreaction(model,'InsI -> InsP');
r1.ReactionRate = 'InsI*kip/vi'; %- is + panc
k1 = addkineticlaw(r1, 'Unknown');
Multiplied about 20 fold, as you can see I have included my volumes within the reaction rates myself (vi). The model functions perfectly and I have corrected the outputs at the end:
[time, x, names] = sbiosimulate(model,csObj,dObj1);
x(:,1) = x(:,1)/vi;
So that they are in concentration, as needed. However, when it comes to sensitivity analysis because I have corrected them post-model it is technically incorrect, it is analysing the absolute quantities. This is quite noticible in the sensitivity to the volumes.
Is there an easy fix to this, I've had to fight dimensionality with units in the past using simbio and I'd be great if there was some way of dividing a compartment output by a volume, for example. It is a functionality that exists in monolix, so I was hopeful it might here!
Thank you for your time.
EDIT:
I think I've worked it out, I had to refactor my model to operate in concentrations, just refitting it now. Now I should just be able to use unitless compartments.