
Beats MATLAB 300% - 400% in some cases ... really!

Financial stock market prediction
Financial stock market prediction of some companies like google and apple Any doubts pls contact emaal- josemebin@gmail.com
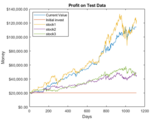
MATLAB example on how to use Reinforcement Learning for developing a financial trading model
Reinforcement Learning For Financial Trading ?How to use Reinforcement learning for financial trading using Simulated Stock Data using MATLAB.SetupTo run:Open RL_trading_demo.prjOpen workflow.mlxRun
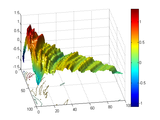
Risk neutral densities for advanced financial models used for option pricing
We present methods for calculating the risk neutral density for several financial models. We consider:Black, Displaced Diffusion, CEV, SABR, Heston, Bates, Hull-White, Heston-Hull-White, VG, NIG
Developing a Financial Market Index Tracker using MATLAB OOP and Genetic Algorithms
Version 1.1.0.1
Mark HoyleFiles used in the webinar of the same name
Files used in the Webinar "Developing a Financial Market Index Tracker using MATLAB OOP and Genetic Algorithms" The zip file contains the data and files used to develop an application to track a
Generate Matlab table for ticker(s) queried through Alphavantage
This example shows how to analyze aspects of risk contagion in financial time series using various mathematical tools.
Exploring Risk Contagion Using Graph Theory and Markov ChainsRecent financial crises and periods of market volatility have heightened awareness of risk contagion and systemic risk among financial
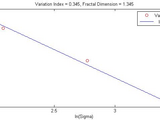
VARINDX calculates the variation index and fractal dimension of a financial time series.
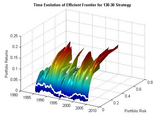
Scripts and data to demonstrate the new Portfolio object in Financial Toolbox.
A .zip file contains a series of scripts that were used in the MathWorks webinar "Using MATLAB to Optimize Portfolios with Financial Toolbox." The scripts demonstrate features of the Portfolio object

Smith & Wilson is a popular algorithm for approximating financial curves such as bond yields or rates.
yields 1%, 2%, 3%, 3.2%, 3.5% and 4% respectively. The user is interested in yields for ZCB at maturities 1, 2, 3, 4, 5, 6, 7, 8, 9, 10, 15, 20 years. The given calibration for the parameter alpha is 0.15

Flexible Statistics Data Analysis Toolbox
version of MATLAB which is supported is now R2019a.Funcion fanplot.m in order to avoid conflicts with function fanplot of the Financial Toolbox has been renamed fanplotFS.m.Old function fanplot.m has been

Improving MATLAB® performance when solving financial optimization problems
Version 1.0.0.1
Jorge PaloschiJorge Paloschi,PHD and Sri Krishnamurthy,CFA May 2011
Optimization algorithms are commonly used in the financial industry with examples including Markowitz portfolio optimization, Asset-Liability management, credit-risk management, volatility surface
This code is designed for detecting chaos in the FO continues chaotic systems.

Carr-Madan and Lewis pricing methods using FFT for many advanced financial models
This is material from the bookFinancial Modelling: Theory, Implementation and Practice with Matlab source from Joerg Kienitz and Daniel Wetterau, WILEY, September 2012Pricing Call Options for
Demos commonly used at The MathWorks financial modeling seminars.
Ten demos, most of which are shown at The MathWork's financial modeling seminars. All of the demos are in their own folders, which contain the code, and a ReadMe file that explains what the demos do
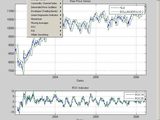
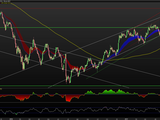
GUI for viewing various simple technical analysis indicators of a time series

Analyzes contact between beams with large deformations in 3D space, using Finite Element method
MatLab object for segmenting sequences of real-valued data with noise, outliers and missing values.
HandsOn-SEA is a low cost robotic device enabling the students to interact with virtual environments

Matlab Dynamics and Control course with Live Scripts and the Temperature Control Lab
Hammond is an experienced researcher in Process Systems Engineering leveraging Data Science, Machine Learning, Optimization, and domain knowledge to achieve optimal solutions. Joshua developed the MATLAB
Dissertation code for MSc in Financial Economics in City University London
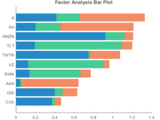
Analyze simulated financial data to through an Exploratory Factor Analysis class.
Pricing a European Call Option based on AWDN (2003) - Journal of Financial Economics
Random Matrix Theory (RMT) Filtering of Financial Time Series for Community Detection
Version 1.0.0.0
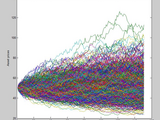
MelUses RMT to create a filtered correlation matrix from a set of financial time series price data
This function eigendecomposes a correlation matrix of financial time series and filters out the Market Mode Component and Noise Component, leaving only the components of the correlation matrix that
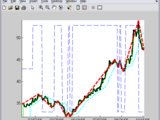
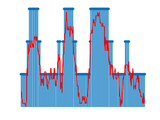
Read Yahoo Stock price and generate ZigZag Wave.
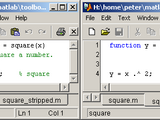
A small collection of utilities for stripping MATLAB comments from strings and files.
Presentation and M-Files for MathWorks Webinar
This zip file contains the Presentation (PDF) and M-files that were demonstrated in the MathWorks Webinar: Using Genetic Algorithms in Financial Applications delivered on Dec 11 2007.The purpose of
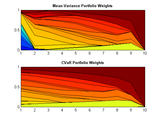
Scripts and data to demonstrate the new PortfolioCVaR object in Financial Toolbox.
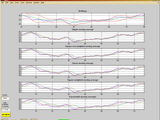
A GUI financial technical analysis toolbox.
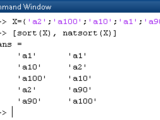
Alphanumeric sort of a cell/string/categorical array, with customizable number format.
. charactersrelative order of numbers vs NaNsExamples%% Multiple integers (e.g. release version numbers):>> A = {'v10.6', 'v9.10', 'v9.5', 'v10.10', 'v9.10.20', 'v9.10.8'};>> sort(A) % for comparison.ans =
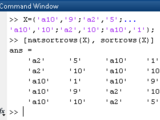
Alphanumeric row sort of a cell/string/categorical/table array, with customizable number format.
{'B','2','X';'A','100','X';'B','10','X';'A','2','Y';'A','20','X'};>> sortrows(A) % SORTROWS for comparison.ans = 'A' '100' 'X' 'A' '2' 'Y' 'A' '20' 'X' 'B' '10' 'X' 'B' '2' 'X'>> natsortrows(A)ans = 'A' '2' 'Y' 'A' '20' 'X
MatLab object for clustering real-valued data with noise, outliers and missing values
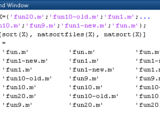
Alphanumeric sort of filenames or filepaths, with customizable number format.

A list of helpful resources for students learning MATLAB & Simulink. List includes tips & tricks, tutorials, videos, cheat sheets, and oppor
? Download a game on File ExchangeMatt Fig (2023). MATLABTETRIS (https://www.mathworks.com/matlabcentral/fileexchange/34513-matlabtetris), MATLAB Central File Exchange. Retrieved July 20, 2023. MATLAB
Retrieve historical stock data from Yahoo! Finance
Files from the November 18, 2010 webinar.
Files used in the webinar - Algorithmic Trading with MATLAB Products for Financial Applications broadcast on November 18, 2010. This webinar can be viewed at

Finding of call/put option price when the underlying asset is Bond.

Black Scholes Fromula, call or put option price of Dividend and Non Dividend paying stock.
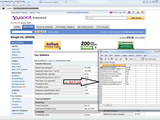
Get HTML-table data into MATLAB via urlread and without builtin browser
Version 1.0.0.0
Sven KoernerBased on getTableFromWeb with a little more functionality for bring in table data from web to MATLAB
Function getTableFromWeb_mod is based on the very very good "pick of the week" from August 20th, 2010 (http://www.mathworks.com/matlabcentral/fileexchange/22465-get-html-table-data-into-matlab) by
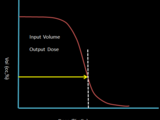
The purpose of this code is to compute a specific Dose metric given a DVH with relative dose and relative volume.
to be in relative form but given the prescribed dose and the volume of the structure, D3cc and V20Gy can be calculated.User needs to follow one of the given example in the description. Start by the
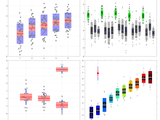
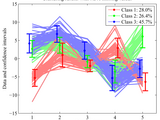
This function visualizes raw (grouped) data along with the mean, 95% confidence interval, and 1 SD.
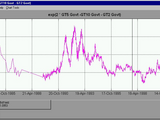
Code for the article in the September 2011 article http://www.wilmott.com/magazine.cfm
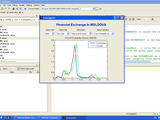
Display in the GUI evolution of the Finance in Moldova

動力分割機構のハイブリッド自動車を想定した燃費性能、電力性能シミュレーション用車両全体モデル
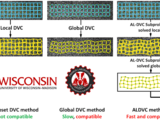
Adaptive Lagrangian Digital Volume Correlation - volumetric displacement and strain measurement based on a hybrid local-global approach
Finite-element-based global DVC method (guarantee global kinematic compatibility and decrease noise by adding regularization penalties).
Creates an N-dimensional sparse array object, for arbitrary N.
be permuted, summed, concatentated, and so forth e.g., >> B=sum( permute([A,A+10], [3,2,1]) ,2) B(:,:,1) = (1,1) 120 (2,1) 20 B(:,:,2) = (1,1) 140
Generate Matlab table for ticker(s) queried through Tiingo
Fetch from bloomberg and put in financial time series object.

Fetch from bloomberg and put in financial time series object.
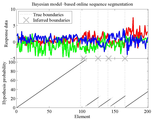
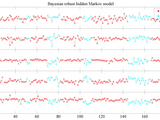
Bayesian algorithm for segmenting real-valued input-output data into non-overlapping segments
Find template Itm in the canny edge image of image Is.

DynaSim simplifies the process of building and simulating models of dynamical systems.
Matlab implementation of an MMSE based noise PSD tracking algorithm for speech enhancement.
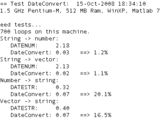
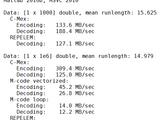
Simple but fast date conversion: 1.3% of DATESTR time, 20% of DATEVEC/ DATENUM time

Fast SVD % function [U,S, V]=rsvd (X, r,q,p) % % usage : % % input: % * X : matrix whose SVD we want % * r : trunction (rank ) for exa
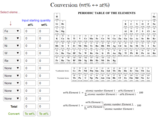
This program allows the conversion from atomic/weight % to weight/atomic % quantities of a system of up to 10 elements.
% Read the image img = imread('C:\Program Files (x86)\IMG-20240221-WA0003.jpg'); % Convert the image to grayscale if it's a color image if

Deep Learning Transformer models in MATLAB
financial text. The output mdl is structure with fields Tokenizer and Parameters that contain the BERT tokenizer and the model parameters, respectively.mdl = finbert("Model",modelName) specifies which FinBERT
Vous pouvez également sélectionner un site web dans la liste suivante :
Amériques
- América Latina (Español)
- Canada (English)
- United States (English)
Europe
- Belgium (English)
- Denmark (English)
- Deutschland (Deutsch)
- España (Español)
- Finland (English)
- France (Français)
- Ireland (English)
- Italia (Italiano)
- Luxembourg (English)
- Netherlands (English)
- Norway (English)
- Österreich (Deutsch)
- Portugal (English)
- Sweden (English)
- Switzerland
- United Kingdom (English)
Asie-Pacifique
- Australia (English)
- India (English)
- New Zealand (English)
- 中国
- 日本Japanese (日本語)
- 한국Korean (한국어)