How to squeeze specific value from 4D array?
It seems like you are asking for a way to identify and retrieve every instance where the temperature value is exactly 25 within ...
2 mois il y a | 0
| A accepté
Unrecognized function or variable " " , when I use my function
The variable t_peaks is not defined in the fit_function. Neither is the peaks variable but this is not throwing an error becaus...
2 mois il y a | 0
how to plot a section of a circle, need help with coding the math
> The variables I have is center position (lat and long), I have right and left aperture (130° total), max range (usually 25-30 ...
2 mois il y a | 0
| A accepté
Publié le
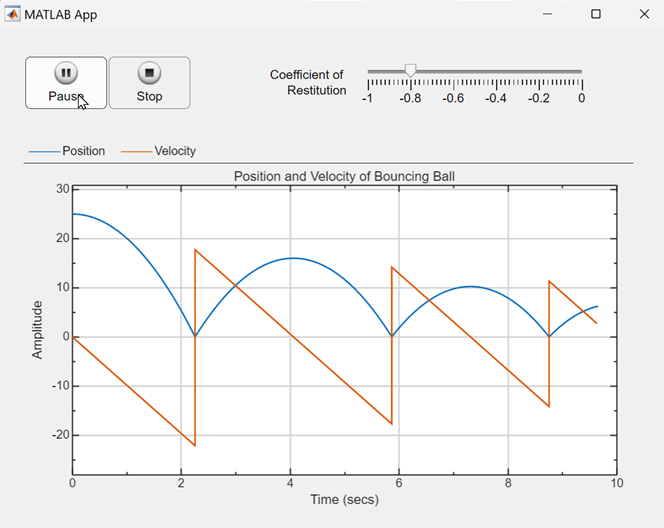
Build Simulink Apps with App Designer
Guest Writer: Robert Philbrick Robert Philbrick is a principal engineer responsible for new interactive App Designer...
2 mois il y a

Appdesigner window ends up in background after uigetfile
Thanks for reporting the problem. This has been fixed in the R2024a beta release and the fix will be available in the genera...
2 mois il y a | 2
Pushbutton sends app designer panel to the back.
Thanks for describing the problem. This is a known issue (previous reports: 1, 2, and others). This has been fixed in the R2...
2 mois il y a | 0
How do I programmatically extract a 3D plot point selected by a user interactively?
Finding the nearest point in 3D space to a mouse click in a 2D representation may pose problems because depth of the mouse click...
2 mois il y a | 1
| A accepté
Unwanted quotation marks when appending a table in pdf report
I don't know whether there is any report generator wizardry that addresses this but a simple solution is to convert the cell-str...
2 mois il y a | 1
Plot Stacked Surfaces with Coloring Appropriate for each Individual Surface
Assuming the three surfaces are on the same axes, you can set the cdata for each surface. The cdata can be normalized so that ea...
3 mois il y a | 0
| A accepté
Why does my plot line appear outside the axes?
This appears to be a bug specific to the OpenGL renderer. Thanks for reporting this issue. Investigation will continue interna...
3 mois il y a | 2
| A accepté
Exported 3D plot into SVG shows swirly white lines between chopped subshapes in inkscape
The white lines issue has been around for a while and is an effect of how viewing software rasterizes vectors. There have been ...
3 mois il y a | 0
Scatter plot text behind plotted data when image copied.
Thanks for the info @Kirstie Beugger. Looks like a bug. When copying graphics in vector format the figure's renderer is switch...
3 mois il y a | 1
| A accepté
how to scale arrows
Quiver scaling can be tough to understand. We recently added the ScaleFactor property (R2024a) to help out. See this answer fo...
3 mois il y a | 0
How can i set the dimension of the arrow in a quiver plot?
Understanding quiver auto scaling When using quiver(X,Y,U,V,__), U and V are the horizontal and vertical vector magnitudes. Ho...
3 mois il y a | 0
rotate3d not working properly with matlab GUI and pcshow function
> ...the rotation of the axis is somehow buggy (everytime I klick again, it jumps to another view) and ... the cursor does not c...
3 mois il y a | 0
view() not returning [az, el] ??
The azimuth and elevation outputs are returned as two separate outputs. f = figure('visible','off'); ax = gca(f); [az, el]...
3 mois il y a | 1
Highlighted
AMA: The secret of staff contributors in the Answers forum
Welcome to MATLAB Central's first Ask Me Anything (AMA) session! Over the next few weeks, I look forward to addressing any...
3 mois il y a | 1
One legend for a group of subtightplots
That FEX function subtightplot is very useful but since R2019b you can use tiledlayout instead and since R2020b, tiledlayout sup...
3 mois il y a | 1
| A accepté
Publié le
Introducing the Color Picker Component
Guest Writer: Kristen Amaddio Kristen Amaddio is the Senior Team Lead for the MATLAB UI Components team. She first joined...
3 mois il y a

Why are my error bars multicoloured with no line?
Understanding array size compatibility errorbar, like plot, supports mixed array sizes in input arguments as long as the sizes ...
3 mois il y a | 0
How to erase a specific elements for the name of string values and then replace them?
Assumptions: "Temp_06_02_24_10_39_34 = 32"; is a string This is not a variable name The month is in the 2nd numeric positio...
3 mois il y a | 1
| A accepté
How to make sparsity pattern graph with grouping
Using pcolor This solution uses pcolor and converts the table of 0s and 1s into grouping values that are used to assign color t...
3 mois il y a | 2
| A accepté
UIalert icon disappears in deployed application
Thanks for reporting this, David. We are aware of the problem. Stay tuned for updates.
3 mois il y a | 0
| A accepté
Publié le
Introducing Transparency to Legends and Rectangles
Guest Writer: Afiq Azaibi Today's R2024a feature highlight is written by Afiq Azaibi, a developer on the Charting Team and...
3 mois il y a

Plot of histogram and probability distribution function.
To equate the colors between the histogram and line pairs, access the object handles from the plot output and then set the Serie...
3 mois il y a | 0
| A accepté
Subplot x-axis
Use linkaxes to link the two x axis limits. When the limits of one x-axis changes, the other will adjust. I made 6 changes to...
3 mois il y a | 0
| A accepté
How to have a different interval between xticks and xticklabels on a datetime plot?
The x_period_dates variable is all you need. It's a datetime vector containing all of the dates at midnight. You just need to ...
3 mois il y a | 0
| A accepté
How to draw an histogram?
> How do I draw an histogram knowing the number of times all elements in a 150x150 matrix appears using matlab? Both histogram ...
4 mois il y a | 0
| A accepté
Given a contour plot is there a function which returns a matrix corresponding to the density of lines at a given (x,y) coordinate?
No, there is not a function that computes the density of contour lines. However, you could build such a function. First, you...
4 mois il y a | 1
| A accepté
Publié le
R2024a release: What’s new in Graphics and App Building?
There are dozens of new graphics and app building features in the MATLAB R2024a release. Here are some highlights to keep...
4 mois il y a