How to Detect and Track Features in a Video with MATLAB
From the series: “How To” Video Series for Biomedical and Pharmaceutical Applications
Learn how to use computer vision to automatically detect and track feature points in a video. For example, you’ll see how to extract intensity values from a video captured during a surgical procedure using a laparoscopic near-infrared fluorescence imaging system. To do so, regions of interest are selected from the desired video frame and feature points are automatically detected by the software. As you’ll see, these points are then tracked from frame to frame even as the camera slightly moves around. In this way, computer vision is helping surgeons automate data collection for research; changes in the fluorescence intensity time histories can be used to discriminate normal tissue from cancerous tissue.
Published: 30 Mar 2022
Hello, everyone. Paul, here, from MathWorks. Today, I'm going to show you how you can use Computer Vision to automatically detect and track feature points in a video. The video we'll be working with was captured during a surgical procedure, using a laparoscopic, near-infrared fluorescence imaging system.
As you see here, this system simultaneously captures and displays videos in both the visible white light and near-infrared spectrums. When used with an injection of indocyanine green fluorescent dye into the bloodstream, this system offers an effective way for clinicians to visualize blood perfusion, as the dye becomes fluorescent when excited by near-infrared light. A team at the University College Dublin Center for Precision Surgery is researching if changes in the fluorescence intensity that result from variations in the dye absorption can be used to discriminate normal tissue from cancerous tissue.
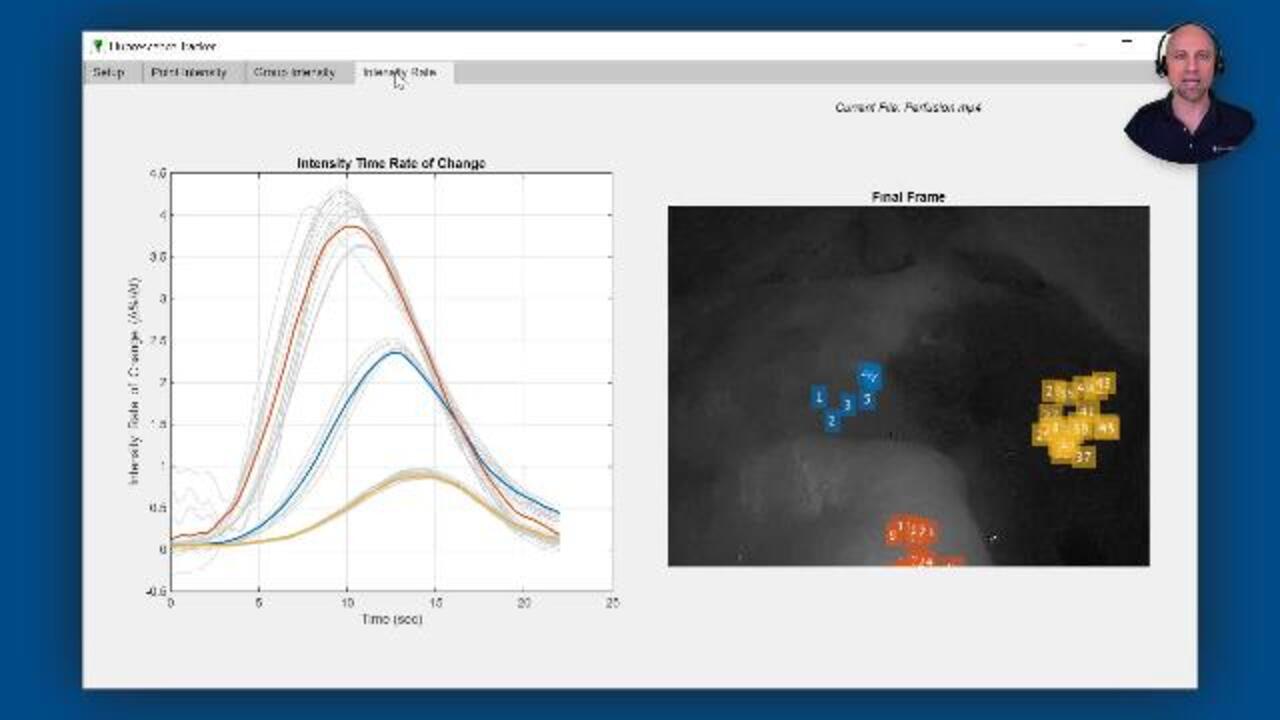
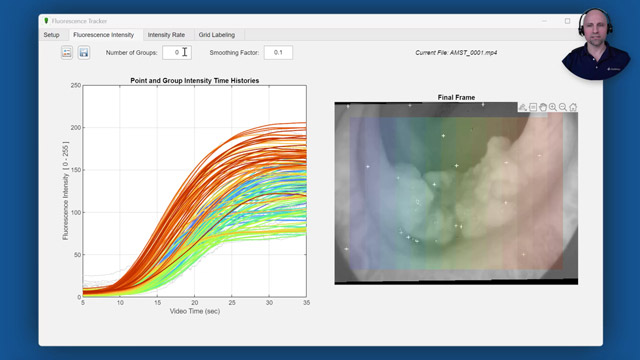
The Fluorescence Tracker App you see here was created to help automate data collection for their analysis. At the start of a video, regions of interest selected from the white light image and feature points are automatically detected. These pixels are then tracked so that the corresponding intensity values can be extracted from the near-infrared fluorescence image. The intensity time histories for each point are then automatically grouped, using a k-means clustering algorithm, and additional statistical analysis is performed to examine differences between the groups.
The initial development of this app was based on the face detection and tracking example in the Computer Vision Toolbox. However, instead of tracking a face, we'll be selecting a region of interest in the previous profusion video and tracking features within that region. After creating a video reader for the desired file, we'll set the initial tracking time to occur just before the dye begins to enter the bloodstream, and then read the current video frame at this time.
Notice that, since the dye has not yet begun absorption, the intensity image is mostly black. Since there are no features for us to track in this image, we'll track points in the color image, and use these locations to extract the corresponding intensity values as they change over time. To do so, we'll first separate the combined white light and near-infrared video frame into two separate images.
We'll then use the imcrop command to select a region of interest from the color image, and display the selected region on both the color and intensity frames. As with the face detection example, the next step is to detect the initial feature points within the selected region of the color image frame. Here, we're detecting corners using the minimum eigenvalue algorithm. But there are many other feature detection options to choose from, such as fast, risk, or serve algorithms, just to name a few. We'll then display these points, and initialize an array to store the corresponding fluorescence intensity values.
With the initial feature points identified, we'll create an initialize a point tracker, using a vision system object to track the points from frame to frame. System objects are optimized for iterative computations that process large streams of data in segments, such as video and audio processing systems. We can then just loop through each frame until we reach the desired stop time.
As you see here, for each point in the previous frame, the point tracker attempts to find the corresponding point in the current frame, even as the camera slightly moves around. The point tracker also returns a validity flag indicating if the track was lost-- for example, if the point goes off the image. Finally, we can display the resulting fluorescence intensity time histories for each point. Since extracting intensity values based on a single pixel can result in noisy signals, we smooth the signals using the smoothdata function.
This functionality was then wrapped in a user interface using App Designer, to create the Fluorescence Tracker App we saw earlier. The Fluorescence Tracker App is available for download via the MathWorks File Exchange or GitHub. And if you'd like to learn more about the research it supported, please check out the recent technical article, Automating Endoscopic Tissue Characterization in Cancer Patients with Computer Vision, by Dr. Ronan Cahill, and his team at University College Dublin.
I hope this quick demonstration illustrated how you can modify MATLAB examples to quickly begin solving your problems. Please visit the Computer Vision Product Page to learn more about other capabilities, such as object detection and semantic segmentation using deep learning Thanks for watching.
Related Products
Learn More


Sélectionner un site web
Choisissez un site web pour accéder au contenu traduit dans votre langue (lorsqu'il est disponible) et voir les événements et les offres locales. D’après votre position, nous vous recommandons de sélectionner la région suivante : United States.
Vous pouvez également sélectionner un site web dans la liste suivante :
Amériques
- América Latina (Español)
- Canada (English)
- United States (English)
Europe
- Belgium (English)
- Denmark (English)
- Deutschland (Deutsch)
- España (Español)
- Finland (English)
- France (Français)
- Ireland (English)
- Italia (Italiano)
- Luxembourg (English)
- Netherlands (English)
- Norway (English)
- Österreich (Deutsch)
- Portugal (English)
- Sweden (English)
- Switzerland
- United Kingdom (English)