Plot Path Gains for TDL-E Delay Profile with SISO
Plot the path gains of a tapped delay line (TDL) single-input/single-output (SISO) channel using an nrTDLChannel object.
Configure a channel with delay profile TDL-E from TR 38.901 Section 7.7.2. Set the maximum Doppler shift to 70 Hz and enable path gain output.
tdl = nrTDLChannel;
tdl.SampleRate = 500e3;
tdl.MaximumDopplerShift = 70;
tdl.DelayProfile = 'TDL-E';
Configure the transmit and receive antenna arrays for SISO operation.
tdl.NumTransmitAntennas = 1;
tdl.NumReceiveAntennas = 1;
Create a dummy input signal. The length of the input determines the time samples of the generated path gain.
in = zeros(1000,tdl.NumTransmitAntennas);
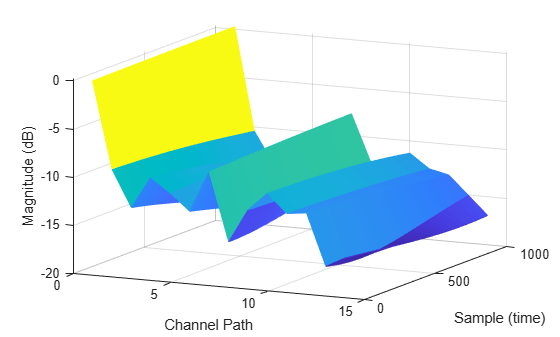
To generate the path gains, call the channel on the input. Plot the results.
[~, pathGains] = tdl(in);
mesh(10*log10(abs(pathGains)));
view(26,17); xlabel('Channel Path');
ylabel('Sample (time)'); zlabel('Magnitude (dB)');