transform
Transform audio datastore
Description
transformDatastore = transform(ADS,@fcn)read
function.
transformDatastore = transform(ADS,@fcn,Name,Value)Name,Value pair arguments.
Examples
Specify the file path to the audio samples included with Audio Toolbox™. Create an audio datastore that points to the specified folder.
folder = fullfile(matlabroot,'toolbox','audio','samples');
ADS = audioDatastore(folder);
Call transform to create a new datastore that mixes multichannel signals to mono.
ADSnew = transform(ADS,@(x)mean(x,2));
Read from the new datastore and confirm that it only outputs mono signals.
while hasdata(ADSnew)
    audio = read(ADSnew);
    fprintf('Number of channels = %d\n',size(audio,2))
end
Number of channels = 1
Number of channels = 1
Number of channels = 1
Number of channels = 1
Number of channels = 1
Number of channels = 1
Number of channels = 1
Number of channels = 1
Number of channels = 1
Number of channels = 1
Number of channels = 1
Number of channels = 1
Number of channels = 1
Number of channels = 1
Number of channels = 1
Number of channels = 1
Number of channels = 1
Number of channels = 1
Number of channels = 1
Number of channels = 1
Number of channels = 1
Number of channels = 1
Number of channels = 1
Number of channels = 1
Number of channels = 1
Number of channels = 1
Number of channels = 1
Number of channels = 1
Number of channels = 1
Number of channels = 1
Number of channels = 1
Number of channels = 1
Number of channels = 1
Number of channels = 1
Number of channels = 1
Number of channels = 1
Number of channels = 1
Number of channels = 1
Number of channels = 1
The audio samples included with Audio Toolbox™ have varying durations. Use the transform function to customize the read function so that it outputs a random five second segment of the audio samples.
Specify the file path to the audio samples included with Audio Toolbox. Create an audio datastore that points to the specified folder.
folder = fullfile(matlabroot,'toolbox','audio','samples');
ADS = audioDatastore(folder);
Define a function to take as input the output of the read function. Make the function extract five seconds worth of data from the audio signal.
function [dataOut,info] = extractSegment(audioIn,info)
    [N,numChan] = size(audioIn);
    newN = round(info.SampleRate*5);
    if newN > N                                % signal length < 5 seconds
        numPad = newN - N + 1;
        dataOut = [audioIn;zeros(numPad,numChan,'like',audioIn)];
    elseif newN < N                            % signal length > 5 seconds
        start = randi(N - newN + 1);
        dataOut = audioIn(start:start+newN-1,:);
    else                                       % signal length == 5 seconds
        dataOut = audioIn;
    end
end
Call transform to create a TransformedDatastore with Transforms set to the function you defined.
ADSnew = transform(ADS,@extractSegment,'IncludeInfo',true)ADSnew =
TransformedDatastore with properties:
UnderlyingDatastores: {audioDatastore}
SupportedOutputFormats: ["txt" "csv" "dat" "asc" "xlsx" "xls" "parquet" "parq" "png" "jpg" "jpeg" "tif" "tiff" "wav" "flac" "ogg" "opus" "mp3" "mp4" "m4a"]
Transforms: {[@extractSegment]}
IncludeInfo: 1
Read the first three audio files and verify that the outputs are five second segments.
for i = 1:3
    [audio,info] = read(ADSnew);
    fprintf('Duration = %d seconds\n',size(audio,1)/info.SampleRate)
end
Duration = 5 seconds
Duration = 5 seconds
Duration = 5 seconds
Use transform to create an audio datastore that returns a mel spectrogram representation from the read function.
Specify the file path to the audio samples included with Audio Toolbox™. Create an audio datastore that points to the specified folder.
folder = fullfile(matlabroot,'toolbox','audio','samples');
ADS = audioDatastore(folder);
Define a function that transforms audio data from a time-domain representation to a log mel spectrogram. The function adds the additional outputs from the melSpectrogram function to the info struct output from reading the audio datastore.
function [dataOut,infoOut] = extractMelSpectrogram(audioIn,info)

    [S,F,T] = melSpectrogram(audioIn,info.SampleRate);

    dataOut = 10*log10(S+eps);
    infoOut = info;
    infoOut.CenterFrequencies = F;
    infoOut.TimeInstants = T;
end
Call transform to create a TransformedDatastore with Transforms set to extractMelSpectrogram.
ADSnew = transform(ADS,@extractMelSpectrogram,'IncludeInfo',true)ADSnew =
TransformedDatastore with properties:
UnderlyingDatastores: {audioDatastore}
SupportedOutputFormats: ["txt" "csv" "dat" "asc" "xlsx" "xls" "parquet" "parq" "png" "jpg" "jpeg" "tif" "tiff" "wav" "flac" "ogg" "opus" "mp3" "mp4" "m4a"]
Transforms: {[@extractMelSpectrogram]}
IncludeInfo: 1
Read the first three audio files and plot the log mel spectrograms. If there are multiple channels, plot only the first channel.
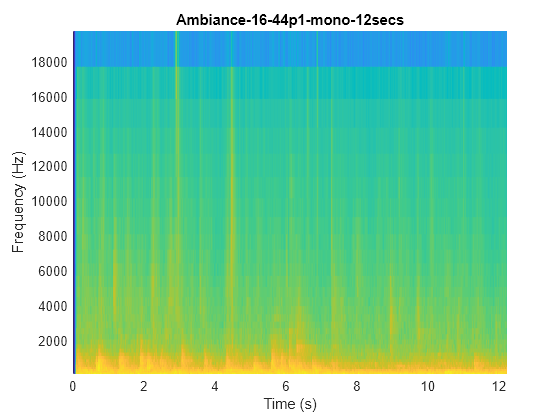
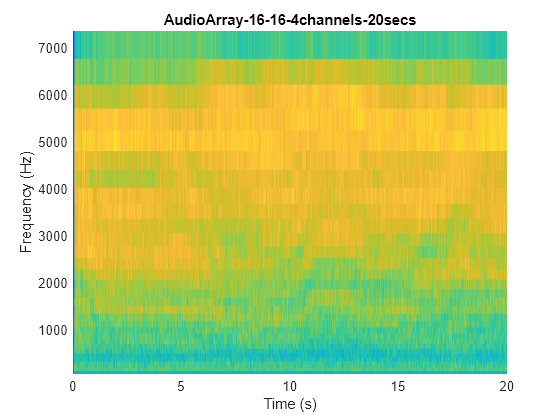
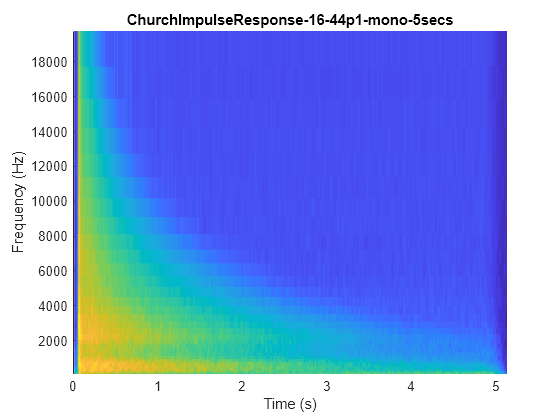
for i = 1:3
    [melSpec,info] = read(ADSnew);

    figure(i)
    surf(info.TimeInstants,info.CenterFrequencies,melSpec(:,:,1),'EdgeColor','none');
    xlabel('Time (s)')
    ylabel('Frequency (Hz)')
    [~,name] = fileparts(info.FileName);
    title(name)
    axis([0 info.TimeInstants(end) info.CenterFrequencies(1) info.CenterFrequencies(end)])
    view([0,90])
end
Use transform to create an audio datastore that returns feature vectors.
Specify the file path to the audio samples included with Audio Toolbox™. Create an audio datastore that points to the specified folder.
folder = fullfile(matlabroot,'toolbox','audio','samples');
ADS = audioDatastore(folder);
Define a function, extractFeatureVector, that transforms the audio data from a time-domain representation to feature vectors.
function [dataOut,info] = extractFeatureVector(audioIn,info)

    % Convert to frequency-domain representation
    windowLength = 256;
    overlapLength = 128;
    [~,f,~,S] = spectrogram(mean(audioIn,2), ...
                            hann(windowLength,"Periodic"), ...
                            overlapLength, ...
                            windowLength, ...
                            info.SampleRate, ...
                            "power", ...
                            "onesided");

    % Extract features
    [kurtosis,spread,centroid] = spectralKurtosis(S,f);
    skewness = spectralSkewness(S,f);
    crest    = spectralCrest(S,f);
    decrease = spectralDecrease(S,f);
    entropy  = spectralEntropy(S,f);
    flatness = spectralFlatness(S,f);
    flux     = spectralFlux(S,f);
    rolloff  = spectralRolloffPoint(S,f);
    slope    = spectralSlope(S,f);

    % Concatenate to create feature vectors
    dataOut = [kurtosis,spread,centroid,skewness,crest,decrease,entropy,flatness,flux,rolloff,slope];

end
Call transform to create a TransformedDatastore with Transforms set to extractFeatureVector.
ADSnew = transform(ADS,@extractFeatureVector,'IncludeInfo',true)
ADSnew =

  TransformedDatastore with properties:

      UnderlyingDatastores: {audioDatastore}
    SupportedOutputFormats: ["txt"    "csv"    "dat"    …    ] (1×20 string)
                Transforms: {[@extractFeatureVector]}
               IncludeInfo: 1
Call read to return the feature vectors for the audio over time.
featureMatrix = read(ADSnew);
[numFeatureVectors,numFeatures] = size(featureMatrix)
numFeatureVectors =

        4215


numFeatures =

    11
Use transform to create an audio datastore that applies bandpass filtering before returning audio from the read function.
Specify the file path to the audio samples included with Audio Toolbox™. Create an audio datastore that points to the specified folder.
folder = fullfile(matlabroot,'toolbox','audio','samples');
ADS = audioDatastore(folder);
Define a function, applyBandpassFilter, that applies a bandpass filter with a passband between 1 and 15 kHz.
function [audioOut,info] = applyBandpassFilter(audioIn,info)

    audioOut = bandpass(audioIn,[1e3,15e3],info.SampleRate);

end
Call transform to create a TransformedDatastore with Transforms set to applyBandpassFilter.
ADSnew = transform(ADS,@applyBandpassFilter,'IncludeInfo',true)ADSnew =
TransformedDatastore with properties:
UnderlyingDatastores: {audioDatastore}
SupportedOutputFormats: ["txt" "csv" "dat" "asc" "xlsx" "xls" "parquet" "parq" "png" "jpg" "jpeg" "tif" "tiff" "wav" "flac" "ogg" "opus" "mp3" "mp4" "m4a"]
Transforms: {[@applyBandpassFilter]}
IncludeInfo: 1
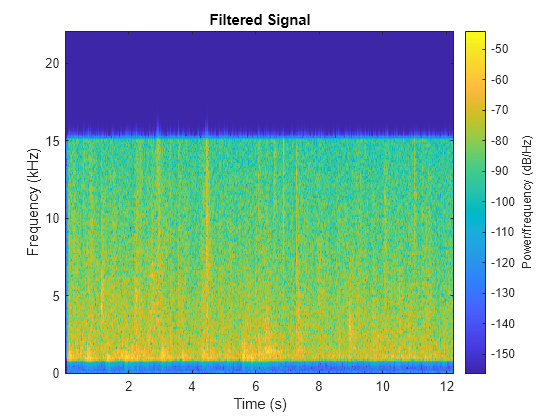
Call read to return the bandpass filtered audio from the transform datastore. Call read to return the bandpass filtered audio from the original datastore. Plot the spectrograms to visualize the difference.
[audio1,info1] = read(ADS);
[audio2,info2] = read(ADSnew);
spectrogram(audio1,hann(512),256,512,info1.SampleRate,'yaxis')
title('Original Signal')

spectrogram(audio2,hann(512),256,512,info2.SampleRate,'yaxis')
title('Filtered Signal')
Input Arguments
Audio datastore, specified as an audioDatastore
object.
Function that transforms data, specified as a function handle. The signature of the
function depends on the IncludeInfo parameter.
If
IncludeInfois set tofalse(default), the function transforms the audio output fromread. The info output fromreadis unaltered.
The transform function must have this signature:
function dataOut = fcn(audio)
...
end
If
IncludeInfois set totrue, the function transforms the audio output fromread, and can use or modify the information returned fromread.
The transform function must have this signature:
function [dataOut,infoOut] = fcn(audio,infoIn)
...
end
Name-Value Arguments
Output Arguments
Version History
Introduced in R2019a