Contenu principal

siiExcitation

R2026b

Create speech intelligibility index (SII) test signals

Since R2026b

    Description

    mtfExcitation = siiExcitation(fs) returns modulation transfer function (MTF) test signals defined in the ANSI S3.5-1997 standard [1]. You can use these signals to measure the SII of an acoustic system.

    example

    [mtfExcitation,speechExcitation] = siiExcitation(fs) also returns the unmodulated long-term average speech spectrum signal.

    [mtfExcitation,speechExcitation,expLevels] = siiExcitation(fs) also returns expected speech spectrum levels for calibration verification.

    example

    [___] = siiExcitation(___,Name=Value) specifies options using one or more name-value arguments, such as the signal duration.

    siiExcitation(___) without any output arguments displays a bar chart of the speech spectrum levels.

    Examples

    collapse all

    Generate excitation signals used to calculate the speech intelligibility index (SII).

    fs = 48e3;
    [mtf,speechExcitation] = siiExcitation(fs);

    Calling siiExcitation with no output arguments displays the speech level across frequency bands.

    siiExcitation(fs)
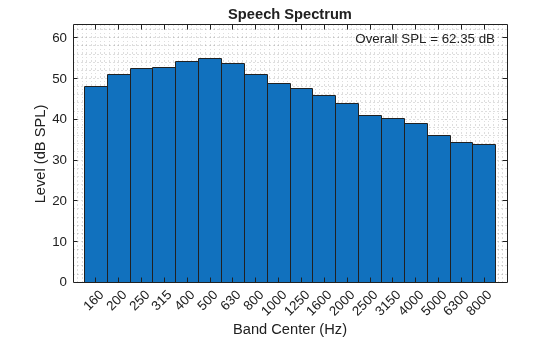
    Figure contains an axes object. The axes object with title Speech Spectrum, xlabel Band Center (Hz), ylabel Level (dB SPL) contains 2 objects of type bar, text.

    Plot the speech level for raised vocal effort using octave-band filters.

    siiExcitation(fs,VocalEffort="raised",Method="octave band")
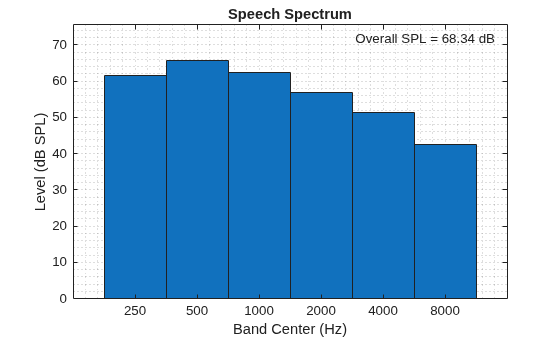
    Figure contains an axes object. The axes object with title Speech Spectrum, xlabel Band Center (Hz), ylabel Level (dB SPL) contains 2 objects of type bar, text.

    Confirm that the levels of the excitation signals generated by siiExcitation match the expected SPL given in the ANSI/ASA S3.5-1997 standard.

    Generate 16-second SII excitation signals for the one-third octave band method.

    fs = 48e3;
    duration = 16;
    [mtfExcitation,speechExcitation,expLevels] = siiExcitation(fs, ...
        Duration=duration, ...
        Method="1/3 octave band",...
        Normalize=false);

    Use splMeter to measure the levels of the speech excitation signal.

    meter = splMeter( ...
        Bandwidth="1/3 octave", ...
        FrequencyRange=[140,8500], ...
        FrequencyWeighting="Z-weighting", ...
        OctaveFilterOrder=16,...
        TimeInterval=duration, ...
        SampleRate=fs);
    [~,Leq] = meter(speechExcitation);
    speechLevels = Leq(end,:);

    Get the expected speech levels and bandwidth adjustment for each band.

    expSpeechLevels = expLevels.SpeechSpectrum;
    bandwidthAdjustment = expLevels.BandwidthAdjustment;

    Plot the difference between the expected and measured levels. Calculate the total difference in all bands in dB.

    figure
    actSpeechSpectrumLevels = round(speechLevels - bandwidthAdjustment,2);
    totalDifference = sum(abs(actSpeechSpectrumLevels - expSpeechLevels));
    
    bar(string(expLevels.NominalMidbandFreq'),[expSpeechLevels;actSpeechSpectrumLevels])
    grid minor
    legend('Expected Levels','Actual Levels')
    xlabel("Mid-Band Frequency (Hz)")
    ylabel("dB SPL/Hz")
    title("Total Difference = " + totalDifference + " dB")
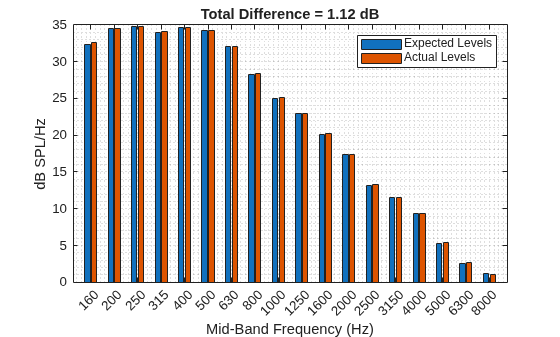
    Figure contains an axes object. The axes object with title Total Difference = 1.12 dB, xlabel Mid-Band Frequency (Hz), ylabel dB SPL/Hz contains 2 objects of type bar. These objects represent Expected Levels, Actual Levels.

    Input Arguments

    collapse all

    Sample rate in Hz, specified as a positive scalar. The sample rate must be at least 22.05 kHz to support the full frequency range of the SII band structure.

    Data Types: single | double

    Name-Value Arguments

    collapse all

    Specify optional pairs of arguments as Name1=Value1,...,NameN=ValueN, where Name is the argument name and Value is the corresponding value. Name-value arguments must appear after other arguments, but the order of the pairs does not matter.

    Example: mtf = siiExcitation(48e3, Method="critical band")

    Duration of the test signals in seconds, specified as a positive scalar. The default value of 16 seconds provides eight cycles of the slowest modulation frequency (0.5 Hz). If you specify a duration less than 16 seconds, siiExcitation issues a warning that the signal might not contain enough modulation cycles for an accurate MTF measurement.

    Data Types: single | double

    Speech level, specified as "standard", "idealized", or a numeric row vector of band levels in dB SPL. When you specify "standard", siiExcitation uses tabulated speech levels from the standard [1]. When you specify "idealized", the function uses a flat 35 dB spectrum up to 500 Hz, decreasing at 9 dB/octave above 500 Hz, adjusted for vocal effort (see VocalEffort). When you specify a numeric vector, the vector must have 6, 18, or 21 elements corresponding to the octave band, 1/3 octave band, or critical band method, respectively. SpeechLevel is mutually exclusive with VocalEffort when specified as a numeric vector.

    Data Types: single | double | string | char

    Overall sound pressure level in dB SPL, specified as a numeric scalar. When you specify this argument, the function adjusts the speech levels so that the overall level matches the value. When you do not specify this argument, siiExcitation uses the overall level for the given vocal effort defined by the standard [1].

    Data Types: single | double

    Vocal effort level, specified as one of the values listed in the table. siiExcitation maps VocalEffort to speech levels from the standard [1] using the values shown in the table. The overall speech level determines the per-band speech level using Tables 1–4 from the standard, depending on the value of Method.

    VocalEffort valueSpeech Levels
    "normal"Speech levels corresponding to an overall speech level of 62.35 dB SPL
    "raised"Speech levels corresponding to an overall speech level of 68.34 dB SPL
    "loud"Speech levels corresponding to an overall speech level of 74.85 dB SPL
    "shout"Speech levels corresponding to an overall speech level of 82.30 dB SPL
    "raised-approximate"Speech levels corresponding to "normal" with each band increased by 7.8 dB
    "loud-approximate"Speech levels corresponding to "normal" with each band increased by 15.6 dB
    "shout-approximate"Speech levels corresponding to "normal" with each band increased by 23.4 dB

    VocalEffort is mutually exclusive with SpeechLevel specified as a vector.

    Data Types: char | string

    Frequency band computation method, specified as "1/3 octave band", "critical band", or "octave band". Method determines the number of frequency bands and the computational accuracy. The methods in descending order of accuracy and number of bands are:

    • Critical band (21 bands)

    • One-third octave band (18 bands)

    • Equally-contributing critical band (17 bands, see note below)

    • Octave band (6 bands)

    The standard recommends against using octave bands when the speech or noise levels vary greatly within one octave [1].

    When SpeechLevel is numeric, Method must be consistent with the number of elements in SpeechLevel. When you do not specify Method, the function uses the default value of "1/3 octave band", unless SpeechLevel is numeric and its length implies a different method.

    Note

    You can use the speechExcitation and mtfExcitation outputs for the critical band method to calculate the SII using the equally-contributing critical band method. If you specify OutputMode as "full", you must manually drop the first, second, twentieth, and twenty-first bands from mtfExcitation. To generate valid excitation signals for the equally-contributing critical band method, use one of the following:

    [mtfExcitation,speechExcitation] = siiExcitation(fs,Method="critical band");

    or

    [mtfExcitation,speechExcitation] = siiExcitation(fs,Method="critical band",OutputMode="full");

    mtfExcitation = mtfExcitation(:,:,3:end-2);

    Data Types: char | string

    Option to normalize output signals to the range [-1, 1], specified as true or false. When you specify true, the function scales both the mtfExcitation and speechExcitation by a common normalization factor such that the maximum absolute amplitude across all signals equals 1. When you specify false, the output signals are in units of Pascals.

    Specify Normalize as false when simulating workflows. Specify Normalize as true for real measurements and calibrate output devices to play back audio at the levels the standard specifies. Use expLevels, the third output of siiExcitation, to view the levels required by the standard.

    Data Types: logical

    Output signal arrangement for the MTF excitation, specified as "merged" or "full". When you set this argument to "merged", the function sums the band-signals for each modulation frequency, resulting in an N-by-9 matrix, where each column corresponds to one of the nine modulation frequencies and N is the length of the excitation signals in samples. When you set this argument to "full", the output is an N-by-9-by-B array, where B is the number of frequency bands.

    Data Types: char | string

    Output Arguments

    collapse all

    MTF test signals, returned as a numeric matrix or array. When OutputMode is "merged", mtfExcitation is an N-by-9 matrix, where N is the number of samples and each column corresponds to one of the nine modulation frequencies (0.5, 1, 1.5, 2, 3, 4, 6, 8, and 16 Hz, respectively). When OutputMode is "full", mtfExcitation is an N-by-9-by-B array where B is the number of frequency bands. The signals are sinusoidally modulated in intensity with a modulation index of one, as specified in the ANSI S3.5-1997 standard [1].

    Unmodulated long-term average speech spectrum signal, returned as an N-by-1 numeric column vector, where N is the number of samples. speechExcitation represents the sum of all frequency band signals without modulation and can be used for combined speech and noise spectrum level (CSNSL) measurement.

    Expected speech spectrum levels for calibration, returned as a structure with the following fields:

    Field NameValue
    SpeechSpectrumSpeech spectrum levels in dB SPL per 1 Hz bandwidth, returned as a 1-by-B numeric vector.
    NominalMidbandFreqNominal mid-band frequencies in Hz for each band, returned as a 1-by-B numeric vector.
    BandwidthAdjustmentBandwidth adjustment factors in dB for each band, returned as a 1-by-B numeric vector.
    OverallSPLOverall sound pressure level in dB SPL, returned as a scalar.

    References

    [1] American National Standards Institute (ANSI). 1997. "Methods for calculation of the speech intelligibility index." ANSI/ASA S3.5-1997 (R2024). ANSI, approved June 6, 1997; reaffirmed September 5, 2024.

    Extended Capabilities

    expand all

    C/C++ Code Generation
    Generate C and C++ code using MATLAB® Coder™.

    Version History

    Introduced in R2026b