plot
Draw phylogenetic tree
Description
plot( draws a phylogenetic tree object
into a figure as a phylogram. The significant distances between branches and nodes are in
the horizontal direction. Vertical distances are arbitrary and have no significance. Tree)
plot(
hides the nonactive branches and all of their descendants in the Figure window.
Tree,ActiveBranches)ActiveBranches is a logical array of size
numBranches-by-1 indicating the active
branches.
plot(___, specifies
options using one or more name-value arguments in addition to the input arguments in
previous syntaxes.Name=Value)
Examples
Create a phytree object from a file.
tr = phytreeread("pf00002.tree")Phylogenetic tree object with 33 leaves (32 branches)
Plot the tree and return a structure with handles to the graphic elements of the phytree object.
h = plot(tr,Type="angular")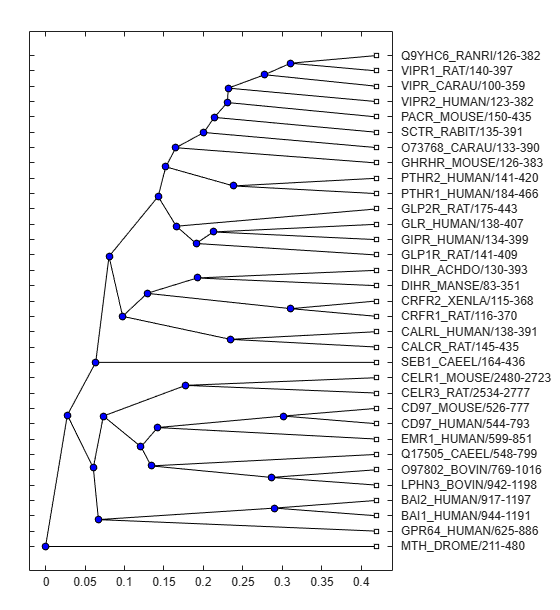
h = struct with fields:
                  axes: [1×1 Axes]
           BranchLines: [65×1 Line]
            BranchDots: [1×1 Line]
              LeafDots: [1×1 Line]
      branchNodeLabels: [32×1 Text]
        leafNodeLabels: [33×1 Text]
    terminalNodeLabels: [33×1 Text]
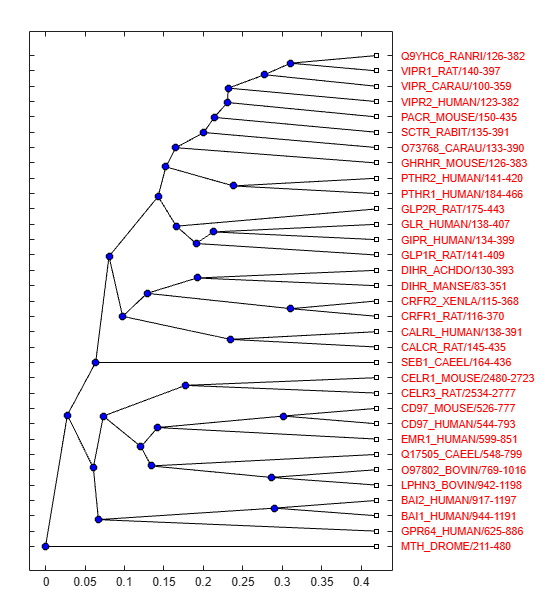
Modify the font size and color of the leaf node labels by using one of the handles in the return structure.
set(h.terminalNodeLabels,FontSize=8,Color=[1 0 0])
Input Arguments
Name-Value Arguments
Specify optional pairs of arguments as
Name1=Value1,...,NameN=ValueN, where Name is
the argument name and Value is the corresponding value.
Name-value arguments must appear after other arguments, but the order of the
pairs does not matter.
Example: plot(tr,Type="square",LeafLabels="true")
Method for drawing a phylogenetic tree, specified as one of these values.
"square" (default) |
|
"angular" |
|
"radial" |
|
"equalangle" | This method hides the significance of the root node and emphasizes clusters, thereby making it useful for visually assessing clusters and detecting outliers.
|
"equaldaylight" | This method hides the significance of the root node and emphasizes clusters, thereby making it useful for visually assessing clusters and detecting outliers.
|


Data Types: char | string
Orientation of a phylogram or cladogram tree, specified as
Position of the root node, specified as "left",
"right", "top", or
"bottom". This position defines the orientation of a phylogram or
cladogram phylogenetic tree in the Figure window when Type is
"square" or "angular".
Data Types: char | string
Rotation angle of phylogenetic tree in the Figure window, specified as a number
between 0 and 360. The angle is measured in degrees. Type must be
"radial", "equalangle", or
"equaldaylight".
Data Types: double
Control for displaying branch labels next to branch nodes, specified as
true or false.
Data Types: logical
Control for displaying leaf labels next to leaf nodes, specified as
true or false. The default is:
true— WhenTypeis"radial","equalangle", or"equaldaylight"false— WhenTypeis"square"or"angular"
Data Types: logical
Control for displaying terminal labels over the axis tick labels when
Type is "square" or
"angular", specified as true or
false.
Data Types: logical
Control for rotation of leaf labels so that the text aligns to the root node when
Type is "radial",
"equalangle", or "equaldaylight", specified as
true or false.
Data Types: logical
Output Arguments
Version History
Introduced in R2006a