Dashboard in Polyspace Platform User Interface
The Dashboard perspective provides an overview of the analysis results in graphical format, with clickable fields that let you drill down into your findings by project, file, or category.

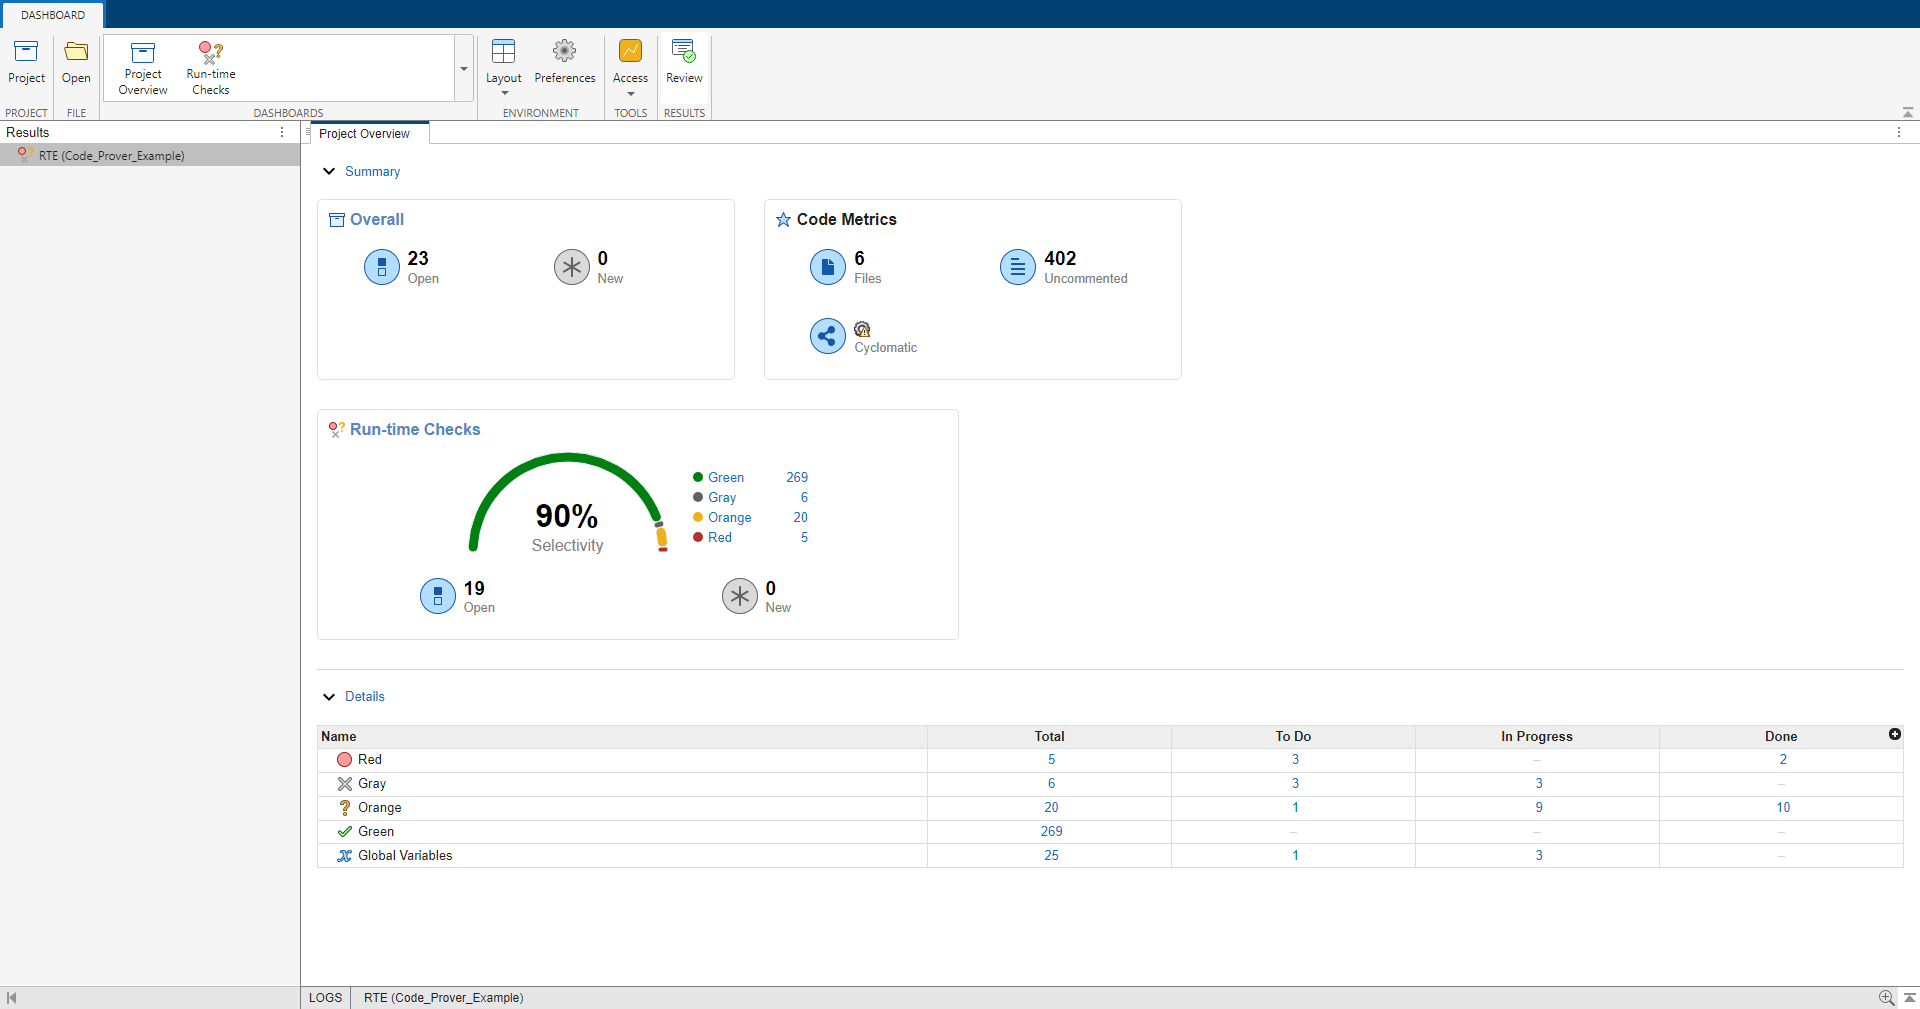
On the Project Overview dashboard, you see statistics for the currently selected project. In the Summary section of the Project Overview dashboard, cards display information about open issues, code metrics, quality objectives, and the different families of findings.
For example, the Run-time Checks card shows the distribution of green, gray, orange, and red findings. The card also shows the Selectivity as a percentage as well as the number of open and new findings. Open findings are those with a status of unreviewed, to fix, to investigate, or other.
Click numbers associated with the graphs on the Dashboard pane to narrow down the results list to the results shown by the graphical elements. For instance, you can click the Red label of the Run-time Checks chart to see only red check in the Results List. For all the ways you can filter results, see Filter and Sort Results in Polyspace Platform User Interface.
You can click the title of the Run-time Checks card to view the Run-time Checks dashboard containing further information about the checks.

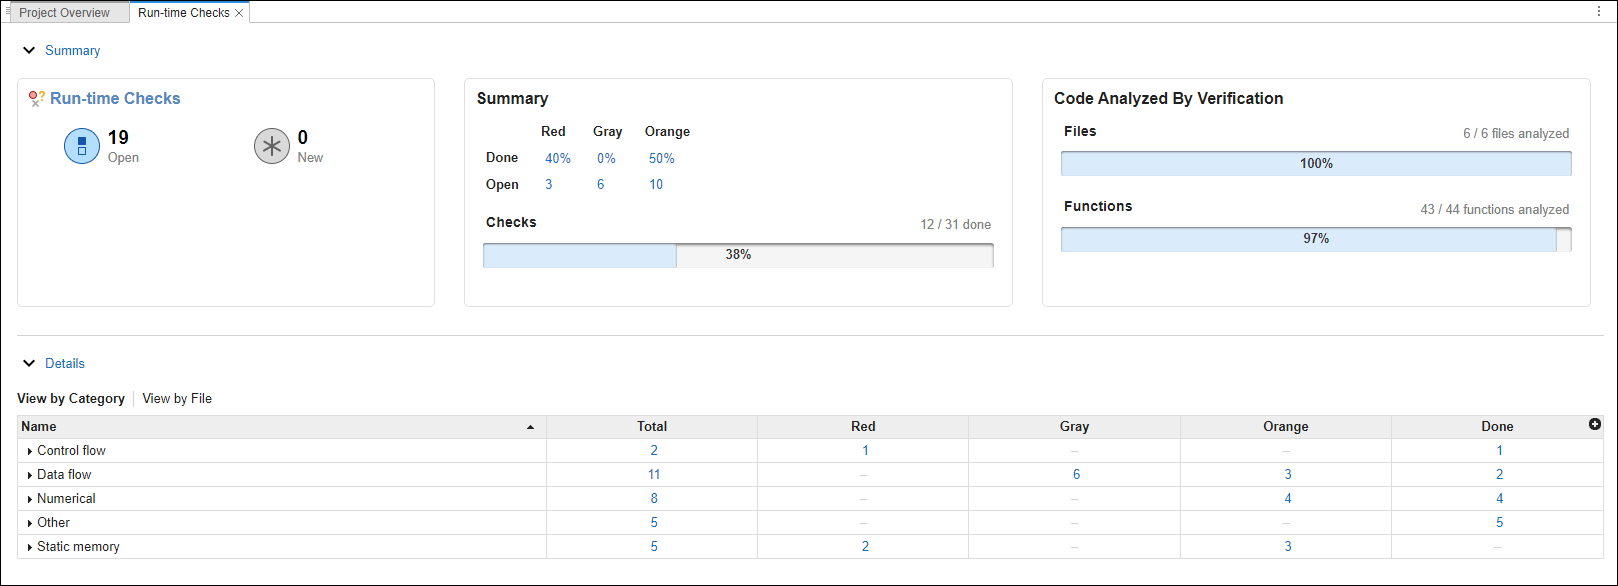
In the Run-Time Checks dashboard:
The Summary section displays review statistics for findings such as the percentage of findings that have a status of open or done. To be Done, a finding has a status of justified, not a defect, no action planned, or annotated.
The Code Analyzed By Verification card displays the number of file and functions and the percentage that were successfully analyzed as a result of the Code Prover analysis.
The Details section displays a table that allows you to drill down into the findings by category or by file. Click any number in the table to view a filtered list of results in the Review perspective.