Dashboard in Polyspace Desktop User Interface
This topic focuses on the Polyspace® desktop user interface. To learn about the equivalent pane in the Polyspace Access™ web interface, see Dashboard in Polyspace Access Web Interface (Polyspace Access).
The Dashboard pane in the Polyspace user interface provides statistics on the verification results in a graphical format.

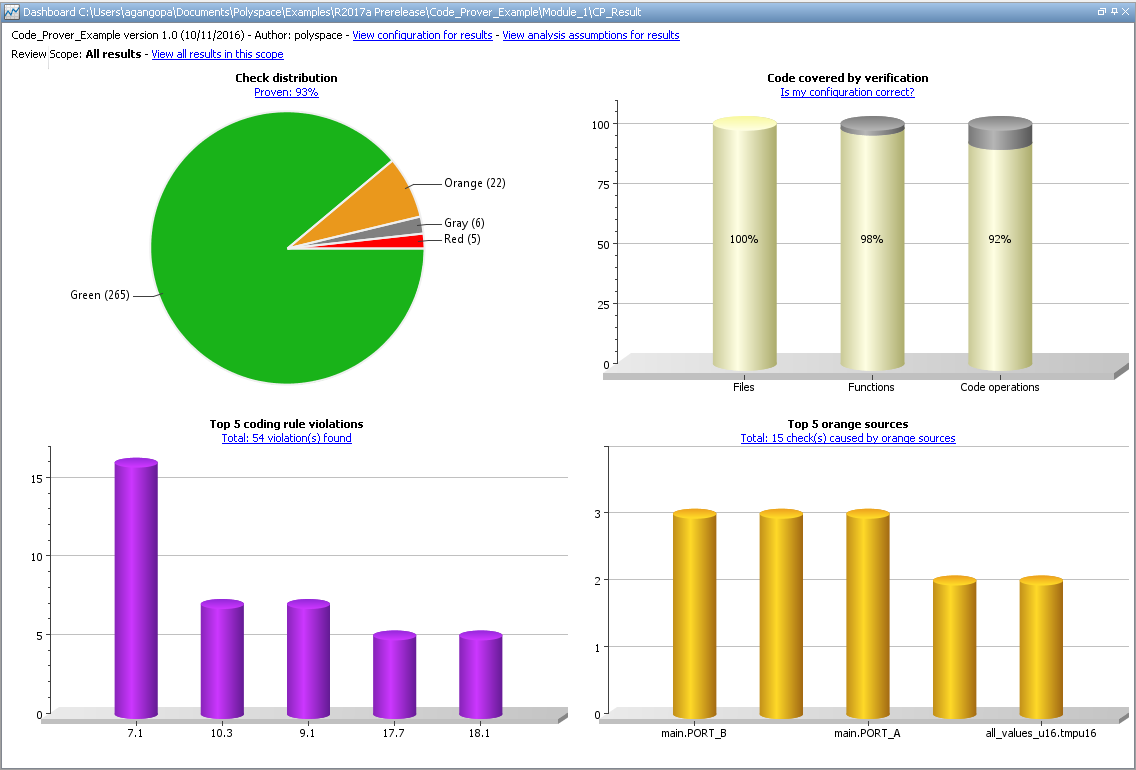
On this tab, you can view four graphs and charts.
Code Covered by Verification
This column graph displays:
The percentage of files checked for run-time errors (verified). You can see this percentage in the Files column.
The percentage of functions in verified files that are checked for run-time errors (verified). You can see this percentage in the Functions column.
The percentage of elementary operations in verified functions that are checked for run-time errors. You can see this percentage in the Code operations column.
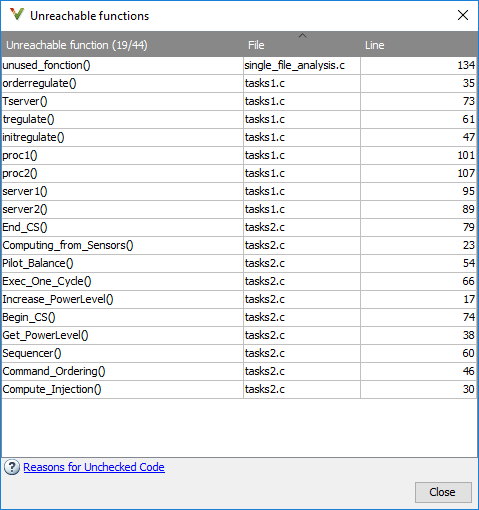
Click the column graph to open the Unreachable functions window.

This window contains:
The number of functions that are unreachable in the format,
Number of unreachable functions/Total number of functionsA list of unreachable functions along with the file and line number where they are defined. Selecting a function displays the function definition in the Source pane.
A low coverage can indicate an early red check or missing function call. Consider the following code:
void coverage_eg(void)
{
  int x;

  x = 1 / x;
  x = x + 1;
  propagate();
}
x — see line 5. The software does not display
checks for these elementary operations:
Division by zero check on the division.
Overflow check on the division result.
Overflow check on the addition result.
Non-initialized local variable check when
xis read in the operationx=x+1.
As the software displays only one out of the five operation checks for the
code, the percentage of elementary operations covered is 1/5 or 20%. The software does not
take into account the checks inside the unreachable function propagate().
For more information, see Reasons for Unchecked Code.
Check Distribution
This pie chart displays the number of checks of each color. For a description of the check colors, see Code Prover Result and Source Code Colors.
Using this pie chart, you can obtain an estimate of:
The number of checks to review.
The selectivity of your verification — the fraction of checks that are not orange.
You can specify certain verification options to reduce the number of orange checks. See Reduce Orange Checks in Polyspace Code Prover.
Top 5 Orange Sources
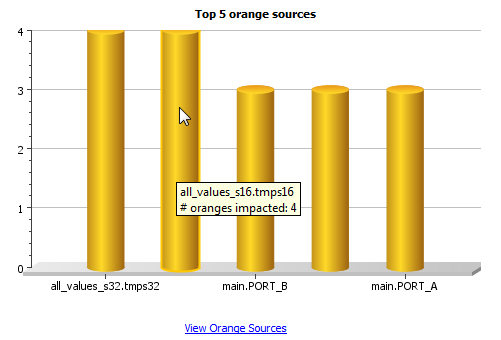
An orange source is a variable or function that leads to an orange check. This column graph displays five orange sources affecting the most number of checks.
An orange source can cause multiple orange checks in Code Prover. When you click an orange source in this graph, the Results List pane shows only the orange checks coming from this source.
For instance, in this code, the unknown value input can cause an
overflow and a division by zero. The variable input is an orange source
that causes two orange
checks.
void func (int input) {
int val1;
double val2;
val1 = input++;
val2 = 1.0/input;
}
Each column represents an orange source. The columns are arranged in the order of number of checks affected. The height of the column indicates the number of checks affected by the corresponding orange source. Place your cursor on a column to open a tooltip showing the source name and the number of checks affected by the source.

Using this chart, you can:
View the five sources affecting the most number of checks. Select a column to view further details of the corresponding orange source in the Orange Sources pane.
Prioritize your review of orange checks. If there are sources affecting a large number of orange checks, address those sources if possible before you begin a systematic review of orange checks. See Create Constraint Template from Code Prover Analysis Results.
Other Dashboard Features
You can also perform the following actions on this pane:
Filter results from the Results List pane.
Click the graphs on the Dashboard pane to narrow down the results list to the results shown by the graphical elements. For instance, you can click a section of the check distribution pie chart to see only checks of a certain color. For all the ways you can filter results, see Filter and Group Results in Polyspace Desktop User Interface.
View the configuration used to obtain the result.
Click the Configuration link on the Dashboard pane to open a read-only form of the configuration. For more information on the options in the Configuration pane, see Complete List of Polyspace Code Prover Analysis Options.
View information about functions that are not reached during the analysis.
Click the Unreachable functions link on the Dashboard pane to open a list of functions that were not verified during analysis. For more information on why a function might not be verified, see Reasons for Unchecked Code.
View the analysis assumptions behind the result.
Click the Analysis assumptions link on the Dashboard pane to see a list of assumptions used during the analysis. Most assumptions listed on the Analysis assumptions pane can be changed using an analysis option (also stated on this pane). For a bigger list of analysis assumptions, see Code Prover Analysis Assumptions.
View the modeling of the multitasking configuration of your code.
Click the Concurrency modeling link on the Dashboard pane to see all entry points to your program. For a description of the Concurrency modeling pane, see Concurrency modeling.