Use Multiple Classes in .NET Assembly
This example shows you how to create a .NET assembly that uses multiple classes to analyze a signal and graph the result.
In this example, you perform the following steps:
Use the MATLAB® Compiler SDK™ product to create an assembly (
SpectraComp) containing more than one class.Access the component in a C# application (
SpectraApp.cs) or a Microsoft® Visual Basic® application (SpectraApp.vb), including use of theMWArrayclass hierarchy to represent data.Build and run the application using the Visual Studio® .NET development environment.
SpectraComp Application
The class SignalAnalyzer performs a fast Fourier transform (FFT) on
an input data array. A method of this class, computefft, returns the
results of that FFT as two output arrays—an array of frequency points and the power
spectral density.
The second class, Plotter, graphs the returned data using the
plotfft method. The two methods computefft and
plotfft encapsulate MATLAB functions. computefft computes the FFT and power spectral
density of the input data and computes a vector of frequency points based on the length of
the data entered and the sampling interval. plotfft plots the FFT data
and the power spectral density in a MATLAB figure window.
Files
| MATLAB Functions | computefft.mplotfft.m |
| MATLAB Function Location | |
| C# Code Location | |
| Visual Basic Code Location | |
Procedure
Copy the following folder that ships with the MATLAB product to your work folder:
matlabroot\toolbox\dotnetbuilder\Examples\VSVersion\NET\SpectraExample
At the MATLAB command prompt, navigate to the new
SpectraExample\SpectraCompsubfolder in your work folder.Examine the MATLAB functions
computefft.mandplotfft.m.Build the .NET component with the .NET Assembly Compiler app or
compiler.build.dotNETAssembly.Name the library
SpectraComp. Map a class namedSignalAnalyzerto the functioncomputefft.m, and map a second class namedPlotterto the functionplotfft.m.For example, if you are using
compiler.build.dotNETAssembly, type:cmap = containers.Map; cmap('SignalAnalyzer') = 'computefft.m'; cmap('Plotter') = 'plotfft'; buildResults = compiler.build.dotNETAssembly(cmap, ... 'AssemblyName','SpectraComp');
For more details, see the instructions in Generate MWArray .NET Assembly and Build .NET Application.
Decide whether you are using C# or Visual Basic to access the component.
C#
If you are using C#, write source code for a C# application that accesses the component.
The sample application for this example is in
SpectraExample\SpectraCSApp\SpectraApp.cs.The following statement shows how to use the
MWArrayclass library to construct aMWNumericArraythat is used as method input to thecomputefftfunction.MWNumericArray data= new MWNumericArray(MWArrayComplexity.Real, MWNumericType.Double, numSamples);The following statements create an instance of the class
SignalAnalyzerand call the methodcomputefft, requesting 3 outputs.SignalAnalyzer signalAnalyzer = new SignalAnalyzer(); ... MWArray[] argsOut= signalAnalyzer.computefft(3, data, interval);Visual Basic
If you are using Visual Basic, write source code for a Visual Basic application that accesses the component.
The sample application for this example is in
SpectraExample\SpectraVBApp\SpectraApp.vb.The following statements show how to use the
MWArrayclass library to construct the necessary data types:Dim data As MWNumericArray = New MWNumericArray_ (MWArrayComplexity.Real, MWNumericType.Double, numSamples) ... Dim resultArray As MWNumericArray = New MWNumericArray_ (MWArrayComplexity.Complex, MWNumericType.Double, numElements)The following statements create an instance of the class
SignalAnalyzerand call the methodcomputefft, requesting three outputs:Dim signalAnalyzer As SignalAnalyzer = New SignalAnalyzer ... Dim argsOut() As MWArray = signalAnalyzer.computefft(3, data, MWArray.op_Implicit(interval))
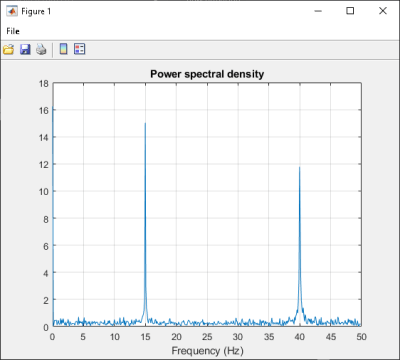
In either case, the
SpectraAppprogram does the following:Constructs an input array with values representing a random signal with two sinusoids at 15 and 40 Hz embedded inside of it
Creates an
MWNumericArrayarray that contains the dataInstantiates a
SignalAnalyzerobjectCalls the
computefftmethod, which computes the FFT, frequency, and the spectral densityInstantiates a
PlotterobjectCalls the
plotfftmethod, which plots the dataUses a
try/catchblock to handle exceptions
Open the .NET project file that corresponds to your application language using Visual Studio.
C#
If you are using C#, the
SpectraCSAppfolder contains a Visual Studio .NET project file for this example. Open the project in Visual Studio .NET by double-clickingSpectraCSApp.csprojin Windows® Explorer. You can also open it from the desktop by right-clicking SpectraCSApp.csproj and selecting Open Outside MATLAB.Visual Basic
If you are using Visual Basic, the
SpectraVBAppfolder contains a Visual Studio .NET project file for this example. Open the project in Visual Studio .NET by double-clickingSpectraVBApp.vbprojin Windows Explorer. You can also open it from the desktop by right-clicking SpectraVBApp.vbproj and selecting Open Outside MATLAB.
Add a reference to your assembly file
SpectraComp.dll.Add a reference to the
MWArrayAPI.If MATLAB is installed on your system matlabroot\toolbox\dotnetbuilder\bin\win64\<framework_version>\MWArray.dllIf MATLAB Runtime is installed on your system <MATLAB_RUNTIME_INSTALL_DIR>\toolbox\dotnetbuilder\bin\win64\<framework_version>\MWArray.dllBuild and run the
SpectraAppapplication in Visual Studio .NET.The program displays the following output:
FFT:
   1.0e+02 *

   4.8646 + 0.0000i
  -0.0289 + 0.1080i
  -0.0326 + 0.0237i
  -0.0141 - 0.0148i
   0.0674 - 0.0487i
   0.0753 + 0.0669i
   0.0275 - 0.0101i
  -0.0429 + 0.0472i
   0.0803 - 0.1163i
  -0.0619 - 0.1072i
   0.0565 - 0.0502i
  -0.0223 + 0.0587i
  -0.0853 - 0.0812i
  -0.0662 - 0.0143i
   0.0543 - 0.0972i
   0.0814 - 0.0463i
  -0.0981 - 0.0190i
   0.0042 + 0.0083i
  -0.0339 + 0.0290i
   0.0291 + 0.0036i

Frequency:
   0.0000 + 0.0000i
   0.0999 + 0.0000i
   0.1998 + 0.0000i
   0.2997 + 0.0000i
   0.3996 + 0.0000i
   0.4995 + 0.0000i
   0.5994 + 0.0000i
   0.6993 + 0.0000i
   0.7992 + 0.0000i
   0.8991 + 0.0000i
   0.9990 + 0.0000i
   1.0989 + 0.0000i
   1.1988 + 0.0000i
   1.2987 + 0.0000i
   1.3986 + 0.0000i
   1.4985 + 0.0000i
   1.5984 + 0.0000i
   1.6983 + 0.0000i
   1.7982 + 0.0000i
   1.8981 + 0.0000i

Power Spectral Density:
  15.3755 + 0.0000i
   0.3534 + 0.0000i
   0.1274 + 0.0000i
   0.0646 + 0.0000i
   0.2628 + 0.0000i
   0.3183 + 0.0000i
   0.0925 + 0.0000i
   0.2016 + 0.0000i
   0.4465 + 0.0000i
   0.3912 + 0.0000i
   0.2387 + 0.0000i
   0.1985 + 0.0000i
   0.3723 + 0.0000i
   0.2140 + 0.0000i
   0.3520 + 0.0000i
   0.2960 + 0.0000i
   0.3158 + 0.0000i
   0.0294 + 0.0000i
   0.1411 + 0.0000i
   0.0927 + 0.0000i

Plotting Power spectral density, please wait...