ChannelMeasurementsConfiguration
R2026bCompute and display occupied bandwidth or adjacent channel power ratio on the spectrum analyzer
Since R2022a
Description
Use the ChannelMeasurementsConfiguration object to compute and
display the occupied bandwidth or adjacent channel power ratio on the spectrum
analyzer.
You can specify the occupied bandwidth or adjacent channel power ratio (ACPR) settings,
frequency span, center frequency, and start and stop frequencies, and control the channel
measurement settings from the spectrum analyzer toolstrip or from the command line. Both the
spectrumAnalyzer
object and the SpectrumAnalyzerBlockConfiguration object support
the ChannelMeasurementsConfiguration object in the command line.
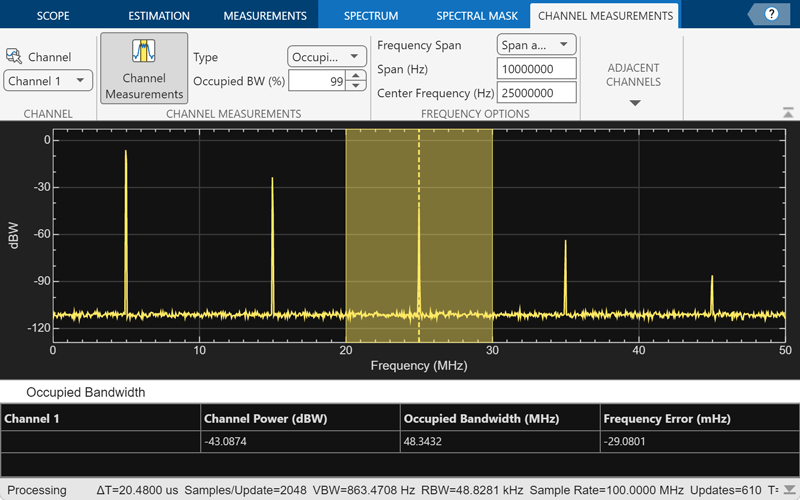
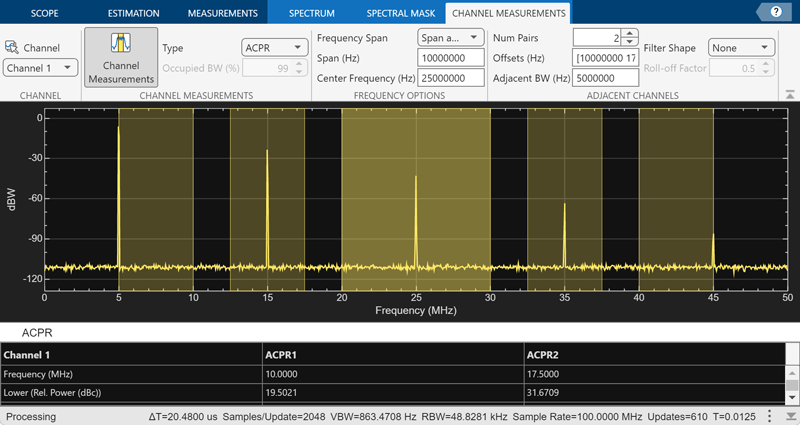
To enable the channel measurements on the spectrum analyzer toolstrip, select Channel Measurements in the Measurements tab. To modify the channel measurement settings, click the Channel Measurements drop-down arrow.
Creation
Description
channMeas = ChannelMeasurementsConfiguration() creates a channel
measurements configuration object channMeas.
Properties
All properties are tunable.
Type of measurement data to display, specified as either
"occupied-bandwidth" or "acpr".
Scope Window Use
On the Measurements tab, select Channel
Measurements, and then click the Channel
Measurements drop-down arrow to set Type to
Occupied BW or ACPR.
To enable Channel Measurements, select Spectrum on the Home tab.
Data Types: char | string
Frequency span mode, specified as one of the following:
"span-and-center-frequency"–– Measure over a frequency range specified inSpanHz and around the frequency value specified inCenterFrequencyproperty."start-and-stop-frequencies"–– Measure over the frequency range [StartFrequency,StopFrequency].
Scope Window Use
On the Measurements tab, select Channel
Measurements, and then click the Channel
Measurements drop-down arrow to set Frequency Span
to Span and Center Frequency or Start and Stop
Frequencies.
To enable Channel Measurements, select Spectrum on the Home tab.
Data Types: char | string
Frequency span over which the object computes the channel measurements, specified as a positive scalar in Hz.
Dependency
To enable this property, set the FrequencySpan property to
"span-and-center-frequency".
Scope Window Use
On the Measurements tab, select Channel
Measurements, and then click the Channel
Measurements drop-down arrow to set Frequency Span
to Span and Center Frequency and Span
(Hz) to a positive scalar.
To enable Channel Measurements, select Spectrum on the Home tab.
Data Types: double
Center frequency of the span over which the object computes the channel measurements, specified as a real scalar in Hz.
Dependency
To enable this property, set the FrequencySpan property to
"span-and-center-frequency".
Scope Window Use
On the Measurements tab, select Channel
Measurements, and then click the Channel
Measurements drop-down arrow to set Frequency Span
to Span and Center Frequency and Center Frequency
(Hz) to a real scalar.
To enable Channel Measurements, select Spectrum on the Home tab.
Data Types: double
Start frequency over which the object computes the channel measurements, specified as a real scalar in Hz.
Dependency
To enable this property, set the FrequencySpan property to
"start-and-stop-frequencies".
Scope Window Use
On the Measurements tab, select Channel
Measurements, and then click the Channel
Measurements drop-down arrow to set Frequency Span
to Start and Stop Frequencies and Start Frequency
(Hz) to a real scalar.
To enable Channel Measurements, select Spectrum on the Home tab.
Data Types: double
Stop frequency over which the object computes the channel measurements, specified as a real scalar in Hz.
Dependency
To enable this property, set the FrequencySpan property to
"start-and-stop-frequencies".
Scope Window Use
On the Measurements tab, select Channel
Measurements, and then click the Channel
Measurements drop-down arrow to set Frequency Span
to Start and Stop Frequencies and set Stop
Frequency (Hz) to a real scalar.
To enable Channel Measurements, select Spectrum on the Home tab.
Data Types: double
Percentage of power over which the object computes the occupied bandwidth, specified as a positive scalar.
Dependency
To enable this property, set the Type property to
"occupied-bandwidth".
Scope Window Use
On the Measurements tab, select Channel Measurements, and then click the Channel Measurements drop-down arrow to set Occupied BW (%) to a positive scalar.
To enable Occupied BW (%), set Type to Occupied BW.
To enable Channel Measurements, select Spectrum on the Home tab.
Data Types: double
Adjacent channel bandwidth, specified as a positive scalar.
Dependency
To enable this property, set the Type property to
"acpr".
Scope Window Use
On the Measurements tab, select Channel Measurements, and then click the Channel Measurements drop-down arrow to set Adjacent BW (Hz) to a positive scalar.
To enable Adjacent BW (Hz), set Type to ACPR.
To enable Channel Measurements, select Spectrum on the Home tab.
Data Types: double
Filter shape for main and adjacent channels, specified as "none",
"gaussian", or "rrc".
Dependency
To enable this property, set the Type property to
"acpr".
Scope Window Use
On the Measurements tab, select Channel
Measurements, and then click the Channel
Measurements drop-down arrow to set Filter Shape to
None, RRC, or
Gaussian.
To enable Filter Shape, set Type to ACPR.
To enable Channel Measurements, select Spectrum on the Home tab.
Data Types: char | string
Channel filter coefficient, specified as a real scalar in the range
[0, 1].
Dependency
To enable this property, set the Type property to
"acpr" and the FilterShape property to
either "gaussian" or "rrc".
Scope Window Use
On the Measurements tab, select Channel Measurements, and then click the Channel Measurements drop-down arrow to set:
Filter Shape to
RRCand specify Roll-off Factor as a real scalar in the range [0,1].Filter Shape to
Gaussianand specify BT Product as a real scalar in the range [0,1].
To enable Filter Shape, set Type to ACPR.
To enable Channel Measurements, select Spectrum on the Home tab.
Data Types: double
Number of adjacent channel pairs, specified as a positive integer in the range
[1, 64].
Dependency
To enable this property, set the Type property to
"acpr".
Scope Window Use
On the Measurements tab, select Channel
Measurements, and then click the Channel
Measurements drop-down arrow to set Num Pairs to a
positive integer in the range [1, 64].
To enable Num Pairs, set Type to ACPR.
To enable Channel Measurements, select Spectrum on the Home tab.
Data Types: double
Frequency of the adjacent channel relative to the center frequency of the main
channel, specified as a real vector of length equal to the number of offset pairs
specified in NumOffsets.
Dependency
To enable this property, set the Type property to
"acpr".
Scope Window Use
On the Measurements tab, select Channel Measurements, and then click the Channel Measurements drop-down arrow to set Offsets (Hz) to a vector of length equal to the number of offset pairs specified in Num Pairs.
To enable Offsets (Hz), set Type to ACPR.
To enable Channel Measurements, select Spectrum on the Home tab.
Data Types: double
Channel measurements flag, specified as true or
false.
Scope Window Use
To enable the channel measurements, select Spectrum on the Home and Channel Measurements on the Measurements tab.
Data Types: logical
Examples
Compute and display the power spectrum of a noisy sinusoidal input signal using the spectrumAnalyzer object. Measure the peaks, cursor placements, adjacent channel power ratio, and distortion values in the spectrum by enabling these properties:
PeakFinderCursorMeasurementsChannelMeasurementsDistortionMeasurements
Initialization
The input sine wave has two frequencies: 1000 Hz and 5000 Hz. Create two dsp.SineWave System objects to generate these two frequencies. Create a spectrumAnalyzer object to compute and display the power spectrum.
Fs = 44100; Sineobject1 = dsp.SineWave(SamplesPerFrame=1024,PhaseOffset=10,... SampleRate=Fs,Frequency=1000); Sineobject2 = dsp.SineWave(SamplesPerFrame=1024,... SampleRate=Fs,Frequency=5000); SA = spectrumAnalyzer(SampleRate=Fs,SpectrumType="power",... PlotAsTwoSidedSpectrum=false,ChannelNames={'Power spectrum of the input'},... YLimits=[-120 40],ShowLegend=true);
Enable Measurements Data
To obtain the measurements, set the Enabled property to true. Label the peak measurements.
SA.CursorMeasurements.Enabled = true; SA.ChannelMeasurements.Enabled = true; SA.PeakFinder.Enabled = true; SA.PeakFinder.LabelPeaks = true; SA.DistortionMeasurements.Enabled = true;
Use getMeasurementsData
Stream in the noisy sine wave input signal and estimate the power spectrum of the signal using the spectrumAnalyzer object. Measure the characteristics of the spectrum. Use the getMeasurementsData function to obtain these measurements programmatically. The isNewDataReady function returns true when there is new spectrum data. Store the measured data in the variable data.
data = []; for Iter = 1:1000 Sinewave1 = Sineobject1(); Sinewave2 = Sineobject2(); Input = Sinewave1 + Sinewave2; NoisyInput = Input + 0.001*randn(1024,1); SA(NoisyInput); if SA.isNewDataReady data = [data;getMeasurementsData(SA)]; end end
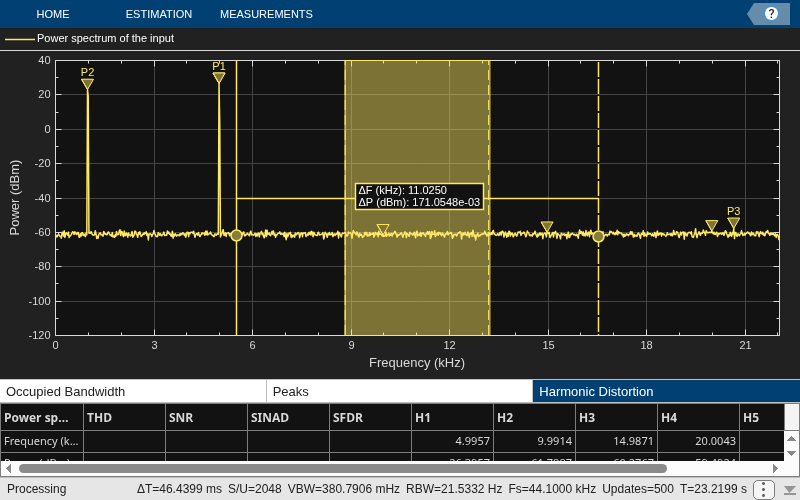
The panels at the bottom of the scope window display the measurements that you have enabled. The values in these panes match the values in the last time step of the data variable. You can access the individual fields of data to obtain the various measurements programmatically.
Compare Peak Values
Use the PeakFinder property to obtain peak values. Verify that the peak values in the last time step of data match the values in the spectrum analyzer plot.
peakvalues = data.PeakFinder(end).Value
peakvalues = 3×1
26.3957
22.7830
-57.9977
frequencieskHz = data.PeakFinder(end).Frequency/1000
frequencieskHz = 3×1
4.9957
0.9905
20.6719
Version History
Introduced in R2022aThe spectrum analyzer toolstrip has been reorganized into these three tabs to give you an easy and streamlined access to the scope settings.
Home tab contains all the general settings for the spectrum and spectrogram display.
Estimation tab contains settings that control the frequency resolution and spectral averaging.
Measurements tab contains settings to control the various measurements supported by the scope.
MATLAB Command
You clicked a link that corresponds to this MATLAB command:
Run the command by entering it in the MATLAB Command Window. Web browsers do not support MATLAB commands.
Sélectionner un site web
Choisissez un site web pour accéder au contenu traduit dans votre langue (lorsqu'il est disponible) et voir les événements et les offres locales. D’après votre position, nous vous recommandons de sélectionner la région suivante : .
Vous pouvez également sélectionner un site web dans la liste suivante :
Comment optimiser les performances du site
Pour optimiser les performances du site, sélectionnez la région Chine (en chinois ou en anglais). Les sites de MathWorks pour les autres pays ne sont pas optimisés pour les visites provenant de votre région.
Amériques
- América Latina (Español)
- Canada (English)
- United States (English)
Europe
- Belgium (English)
- Denmark (English)
- Deutschland (Deutsch)
- España (Español)
- Finland (English)
- France (Français)
- Ireland (English)
- Italia (Italiano)
- Luxembourg (English)
- Netherlands (English)
- Norway (English)
- Österreich (Deutsch)
- Portugal (English)
- Sweden (English)
- Switzerland
- United Kingdom (English)