Obtain Measurements Data Programmatically for Spectrum Analyzer Block
Compute and display the power spectrum of a noisy sinusoidal input signal using the Spectrum Analyzer block. Measure the cursor placements, adjacent channel power ratio, distortion, and peak values in the spectrum by enabling these block configuration properties:
CursorMeasurementsChannelMeasurementsDistortionMeasurementsPeakFinder
Open and Inspect the Model
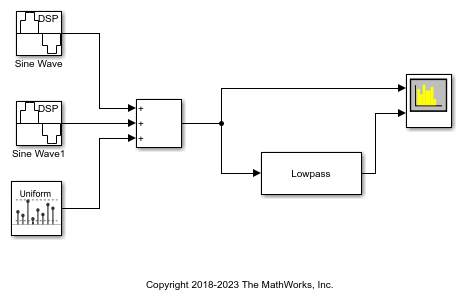
Filter a streaming noisy sinusoidal input signal using a Lowpass Filter block. The input signal consists of two sinusoidal tones: 1 kHz and 15 kHz. The noise is white Gaussian noise with a mean of 0 and a variance of 0.05. The sampling frequency is 44.1 kHz. Open the model and inspect the parameter values in the blocks.
model = 'spectrumanalyzer_measurements.slx';
open_system(model)
Access the configuration properties of the Spectrum Analyzer block using the get_param function.
sablock = 'spectrumanalyzer_measurements/Spectrum Analyzer';
cfg = get_param(sablock,'ScopeConfiguration');
Enable Measurements Data
To obtain the measurements, set the Enabled property to true. Label the peak measurements.
cfg.CursorMeasurements.Enabled = true;
cfg.ChannelMeasurements.Enabled = true;
cfg.DistortionMeasurements.Enabled = true;
cfg.PeakFinder.Enabled = true;
cfg.PeakFinder.LabelPeaks = true;
Simulate the Model
Run the model. The Spectrum Analyzer block compares the original spectrum with the filtered spectrum.
sim(model)
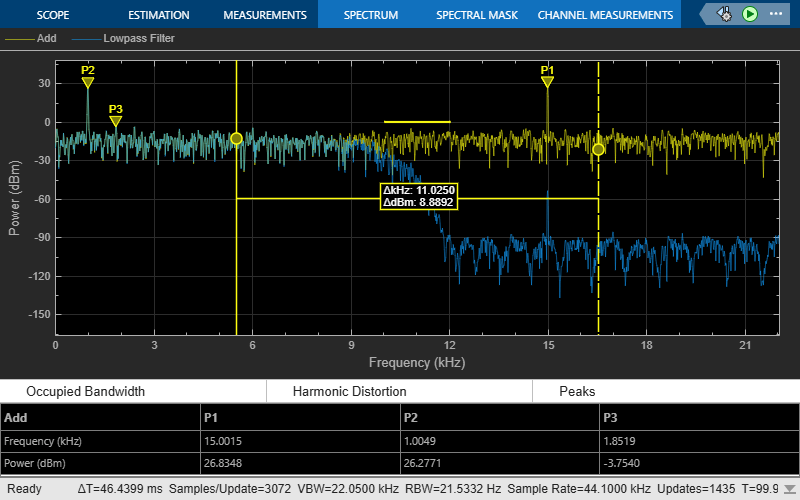
The panels at the bottom of the spectrum analyzer window display the measurements that you have enabled.
Use getMeasurementsData function
Use the getMeasurementsData function to obtain the measurements programmatically.
data = getMeasurementsData(cfg)
data =

  1×5 table

    SimulationTime    PeakFinder    CursorMeasurements    ChannelMeasurements    DistortionMeasurements
    ______________    __________    __________________    ___________________    ______________________

     {[99.9967]}      1×1 struct        1×1 struct            1×1 struct               1×1 struct
The values shown in the measurement panels match the values shown in data. You can access the individual fields of data to obtain the various measurements programmatically.
Compare Peak Values
As an example, compare the peak values. Verify that the peak values obtained by data.PeakFinder match with the values in the spectrum analyzer window.
peakvalues = data.PeakFinder.Value
frequencieskHz = data.PeakFinder.Frequency/1000
peakvalues =

   26.9429
   26.3691
   -4.7536


frequencieskHz =

   15.0015
    1.0049
    0.7178