Code Verification and Profiling Using PIL Testing on Renesas RH850 Microcontrollers
This example shows how to use the Embedded Coder ® Support Package for Renesas® RH850 Microcontrollers to perform Processor-in-the-Loop (PIL) profiling on the Renesas RH850 U2A16 Starter Kit. In PIL simulation, the control algorithm executes on the target hardware while the plant model runs on the host machine. This configuration enables you to measure and compare execution times, as well as verify numerical equivalence between simulation and hardware implementations.
This example illustrates code verification and profiling for key control algorithms. In this workflow, you will:
Verify code execution on the target hardware using PIL testing.
Measure algorithm execution time and generate a comprehensive PIL profiling report.
Perform stack profiling and generate a detailed stack usage report.
This process leverages both the SIL/PIL Manager and command-line tools. Results are automatically transferred back to Simulink, allowing you to verify that the deployed code matches the original model design.
For more information, see Choose a SIL or PIL Approach and SIL/PIL Manager.
Prerequisites
Before you begin,
Complete the Simulink Onramp tutorial.
Complete the Hardware Setup for Embedded Coder Support Package for Renesas RH850 Microcontrollers.
Go through SIL/PIL Manager documentation.
Familiarize with Top and model ref PIL example for Renesas RH850.
Required Hardware
Renesas RH850 U2A16 starter kit (Y-ASK-RH850U2A)
USB type C cable
Renesas E2 emulator
Ribbon cable
20-Pin to 14-Pin conversion adapter
Power supply unit: 12V/1A
Configure PIL Model
1. Open example models.
Open the
renesas_pmsm_foc_sim.slxmodel. This model simulates the PMSM motor and the FOC algorithm for closed-loop speed control.
modelName = "renesas_pmsm_foc_sim.slx";
open_system(modelName)
Open the
CurrentControl_ModelRef.slxmodel. This model implements the Current Control algorithm for closed-loop operation of PMSM.
modelName = "CurrentControl_ModelRef.slx";
open_system(modelName)
2. Configure hardware settings.
In the
CurrentControl_ModelRef.slxmodel, click Modeling > Model Settings to open the Configuration Parameters dialog.In the Configuration Parameters dialog box, navigate to Hardware Implementation > Hardware board and select
Renesas RH850 U2A Basedboard.Navigate to Target hardware resources > Connectivity and enter the COM Port number. To find the COM port number, check the Device Manager on your PC.
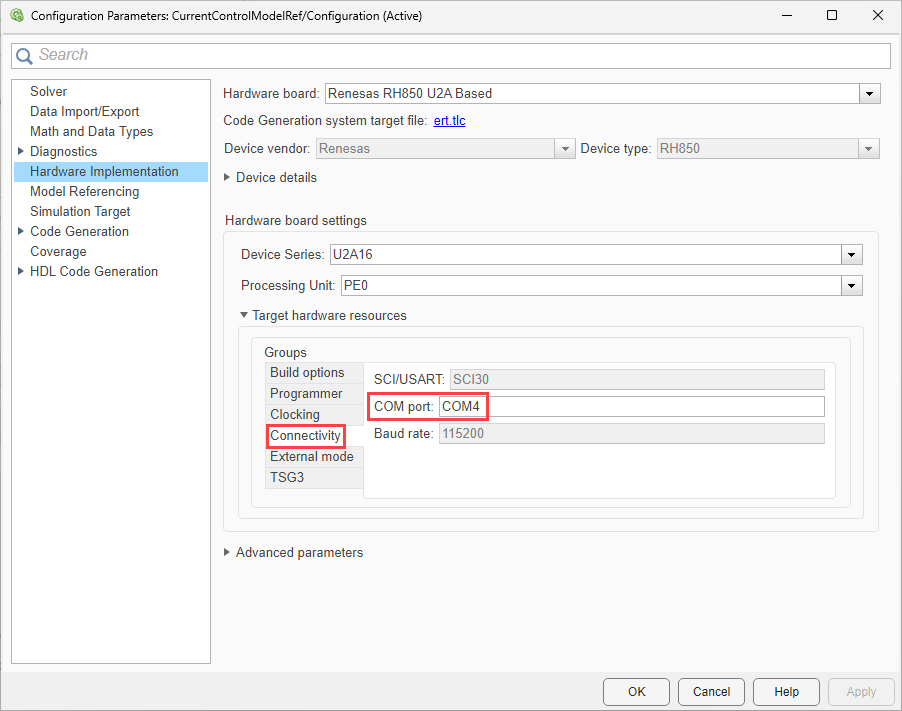
3. Click Apply and OK.
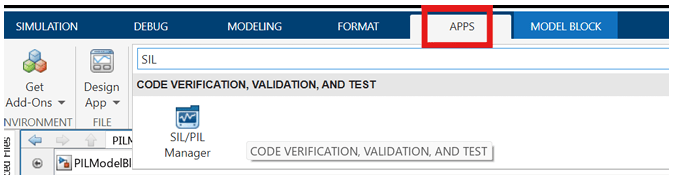
4. Set up SIL/PIL Manager.
In the Simulink toolstrip of
renesas_pmsm_foc_sim.slxmodel, click Apps and then select SIL/PIL Manager.
In the System Under Test section, select Model blocks in SIL/PIL mode.
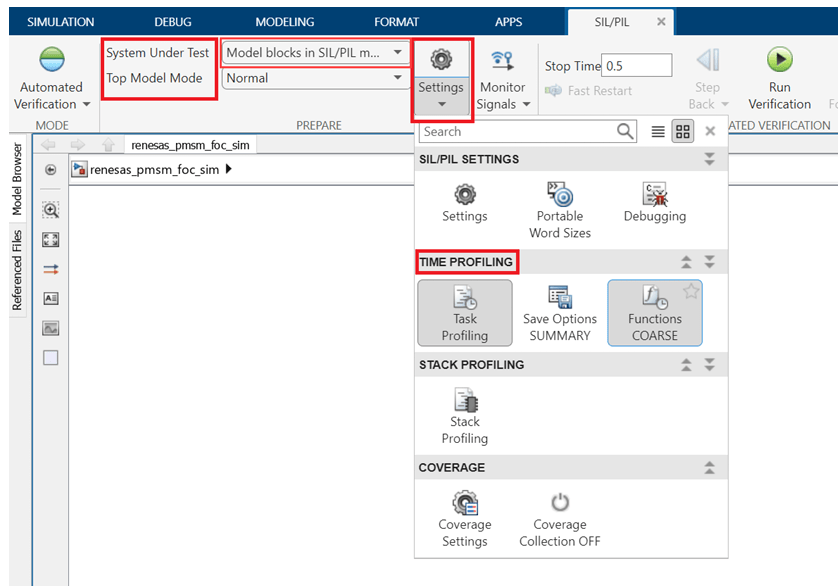
In the Connectivity tab, enter the COM Port number on which the FTDI is connected. You can find this COM port number in the Device Manager.
5. Configure Profiling Options: In the Time Profiling options, enable the task profiling options as needed. In this example, set the Summary Options to Summary Only and Functions Coarse.
6. Run SIL/PIL Simulation: Click Run SIL/PIL from the SIL/PIL tab to run the normal and PIL simulation.
Note: PIL simulation takes longer than the host-machine-based simulation. This is because of the serial communication (inputs and outputs of the Current Control (PIL) subsystem) between the host machine and subsystem that runs on the target hardware.
Analyze Results
Verify Numerical Equivalence
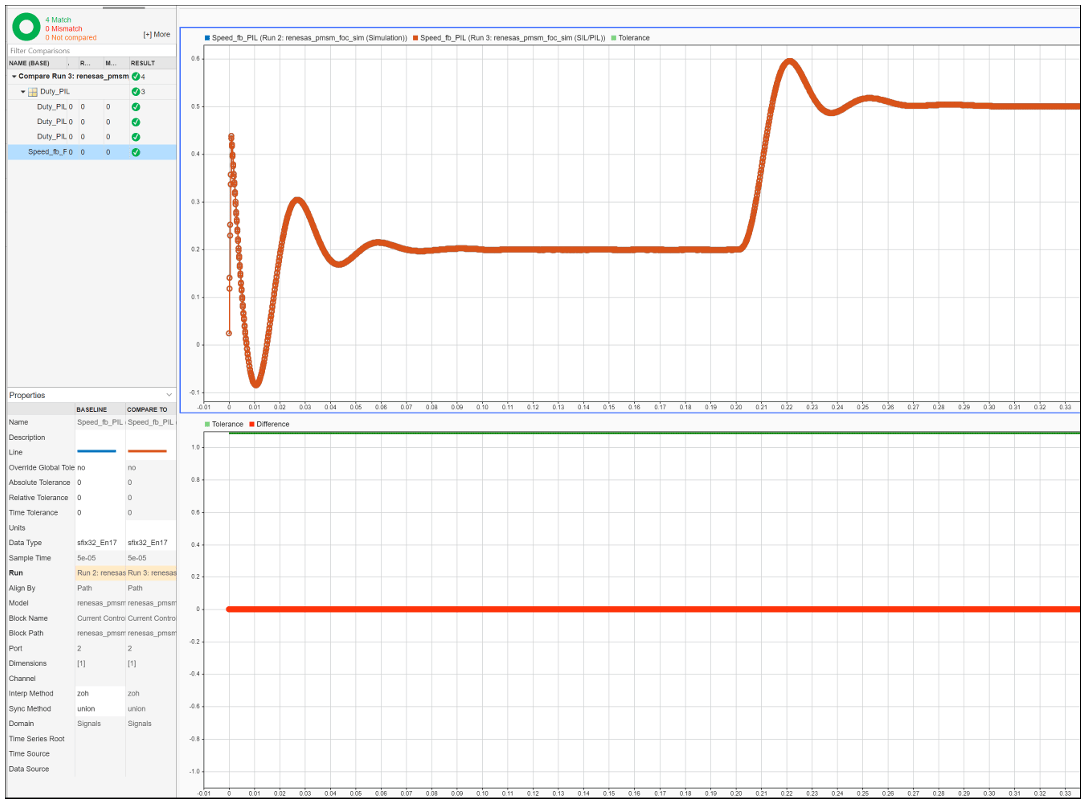
After the simulation, click Compare Runs from the SIL/PIL tab.
Compare the signals logged during host-machine-based simulation and PIL simulation (executed on the target hardware). This comparison helps verify the accuracy of host-machine-based simulation and PIL simulation results. This plot compares the speed feedback signals from the Current Control (PIL) and Current Control (normal simulation)
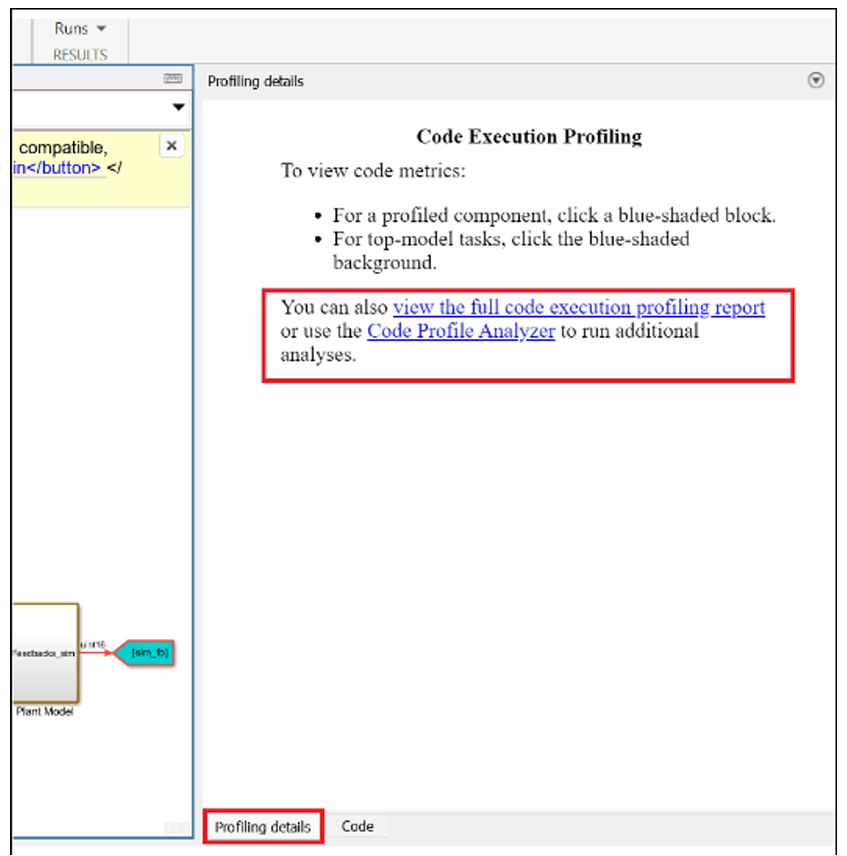
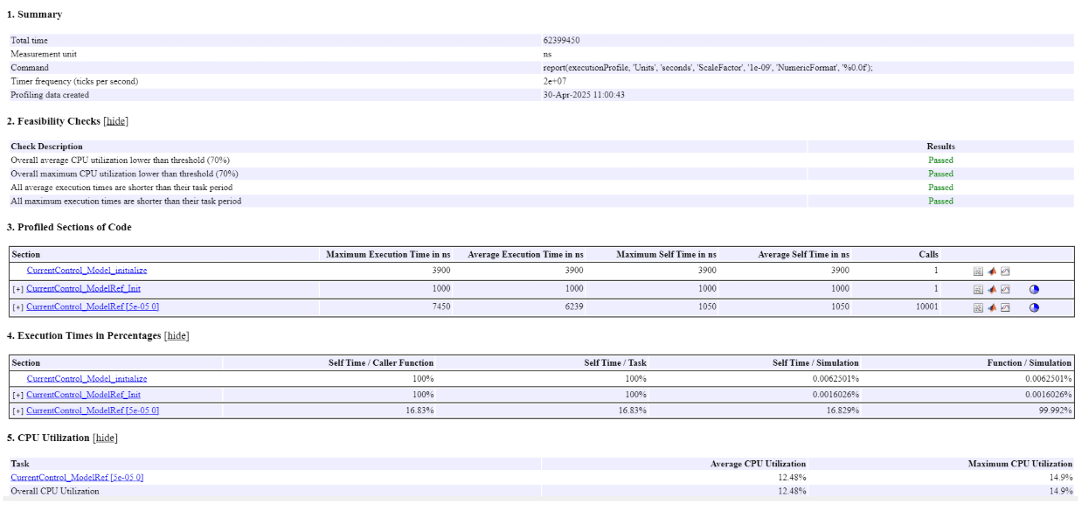
Review Task Profiling Report
When PIL simulation ends, a task profiling report is generated. You can also access this report from the bottom right corner of the model, as shown in this image
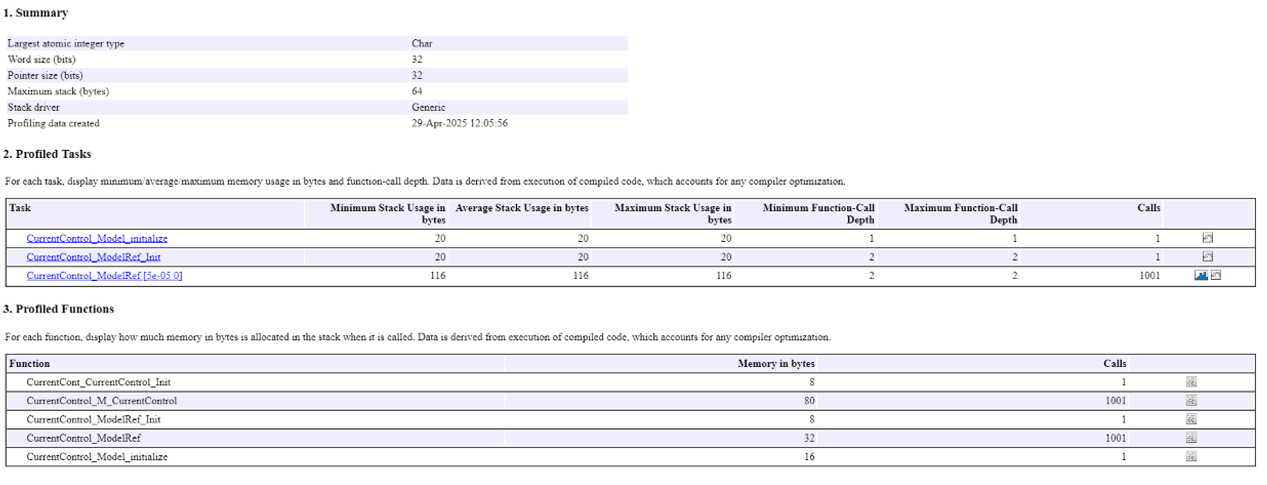
Perform Stack Profiling
To analyze stack usage:
Disable task profiling and enable stack profiling in the configuration options.
Rerun run the PIL Simulation.
On completion, a stack profiling report will be generated. Review the report to ensure stack usage is within hardware limits.