chaikvolat
Chaikin volatility
Description
volatility = chaikvolat(Data)
volatility = chaikvolat(___,Name,Value)
Examples
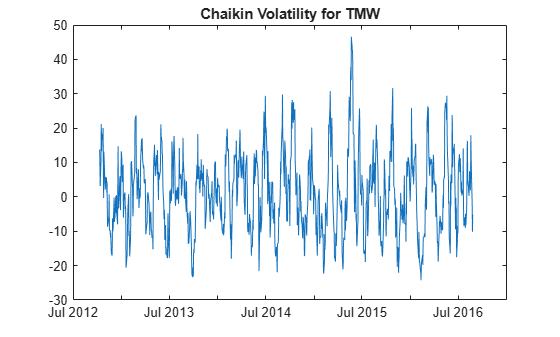
Load the file SimulatedStock.mat, which provides a timetable (TMW) for financial data for TMW stock.
load SimulatedStock.mat
volatility = chaikvolat(TMW,'NumPeriods',14,'WindowSize',14);
plot(volatility.Time,volatility.ChaikinVolatility)
title('Chaikin Volatility for TMW')
Input Arguments
Name-Value Arguments
Output Arguments
More About
References
[1] Achelis, S. B. Technical Analysis from A to Z. Second Edition. McGraw-Hill, 1995, pp. 304–305.