highlow
High, low, open, close chart
Description
highlow( displays a highlow chart
from a series of opening, high, low, and closing prices of a security. The plots are
vertical lines whose top is the high, bottom is the low, open is a left tick, and
close is a right tick. Data)
Examples
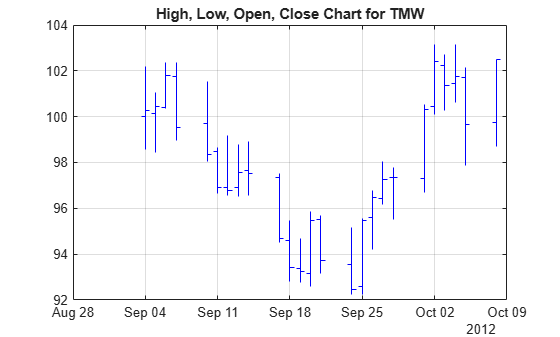
Load the file SimulatedStock.mat, which provides a timetable (TMW) for financial data for TMW stock. The highlow chart plots the price data using blue lines.
load SimulatedStock.mat
range = 1:25;
highlow(TMW(range,:),'b');
title('High, Low, Open, Close Chart for TMW')
Input Arguments
Data for opening, high, low, and closing prices, specified as a matrix,
table, or timetable. For matrix input, Data is an
M-by-4 matrix of opening, high,
low, and closing prices stored in the corresponding columns. Timetables and
tables with M rows must contain variables named
'Open', 'High',
'Low', and 'Close' (case
insensitive).
Data Types: double | table | timetable
(Optional) Three element color vector, specified as a [R G
B] color vector or a string specifying the color name. The
default color differs depending on the background color of the figure
window.
RGB triplets and hexadecimal color codes are useful for specifying custom colors.
An RGB triplet is a three-element row vector whose elements specify the intensities of the red, green, and blue components of the color. The intensities must be in the range
[0,1]; for example,[0.4 0.6 0.7].A hexadecimal color code is a character vector or a string scalar that starts with a hash symbol (
#) followed by three or six hexadecimal digits, which can range from0toF. The values are not case sensitive. Thus, the color codes"#FF8800","#ff8800","#F80", and"#f80"are equivalent.
Alternatively, you can specify some common colors by name. This table lists the named color options, the equivalent RGB triplets, and hexadecimal color codes.
| Color Name | Short Name | RGB Triplet | Hexadecimal Color Code | Appearance |
|---|---|---|---|---|
"red" | "r" | [1 0 0] | "#FF0000" |
|
"green" | "g" | [0 1 0] | "#00FF00" |
|
"blue" | "b" | [0 0 1] | "#0000FF" |
|
"cyan"
| "c" | [0 1 1] | "#00FFFF" |
|
"magenta" | "m" | [1 0 1] | "#FF00FF" |
|
"yellow" | "y" | [1 1 0] | "#FFFF00" |
|
"black" | "k" | [0 0 0] | "#000000" |
|
"white" | "w" | [1 1 1] | "#FFFFFF" |
|
This table lists the default color palettes for plots in the light and dark themes.
| Palette | Palette Colors |
|---|---|
Before R2025a: Most plots use these colors by default. |
|
|
|
You can get the RGB triplets and hexadecimal color codes for these palettes using the orderedcolors and rgb2hex functions. For example, get the RGB triplets for the "gem" palette and convert them to hexadecimal color codes.
RGB = orderedcolors("gem");
H = rgb2hex(RGB);
Before R2023b: Get the RGB triplets using RGB =
get(groot,"FactoryAxesColorOrder").
Before R2024a: Get the hexadecimal color codes using H =
compose("#%02X%02X%02X",round(RGB*255)).
Data Types: double | string
(Optional) Valid axis object, specified as an axes object. The highlow
plot is created in the axes specified by ax instead of in
the current axes (ax = gca). The option
ax can precede any of the input argument
combinations.
Data Types: object