Using Maximum and Expected Maximum Drawdown
Introduction
Maximum drawdown is the maximum decline of a series, measured as return, from a peak to a nadir over a period of time. Although additional metrics exist that are used in the hedge fund and commodity trading communities (see Pederson and Rudholm-Alfvin [20] in Bibliography), the original definition and subsequent implementation of these metrics is not yet standardized.
It is possible to compute analytically the expected maximum drawdown for a Brownian motion with drift (see Magdon-Ismail, Atiya, Pratap, and Abu-Mostafa [16] Bibliography). These results are used to estimate the expected maximum drawdown for a series that approximately follows a geometric Brownian motion.
Use maxdrawdown and emaxdrawdown to calculate the
maximum and expected maximum drawdowns.
Maximum Drawdown
This example shows how to compute the maximum drawdown (MaxDD) using example data with a fund, a market, and a cash series.
load FundMarketCash
MaxDD = maxdrawdown(TestData)
MaxDD = 1×3
0.1658 0.3381 0
The maximum drop in the given time period is 16.58% for the fund series and 33.81% for the market. There is no decline in the cash series, as expected, because the cash account never loses value.
maxdrawdown can also return the indices (MaxDDIndex) of the maximum drawdown intervals for each series in an optional output argument.
[MaxDD, MaxDDIndex] = maxdrawdown(TestData)
MaxDD = 1×3

    0.1658    0.3381         0
MaxDDIndex = 2×3

     2     2   NaN
    18    18   NaN
The first two series experience their maximum drawdowns from the second to the 18th month in the data. The indices for the third series are NaNs because it never has a drawdown.
The 16.58% value loss from month 2 to month 18 for the fund series is verified using the reported indices.
Start = MaxDDIndex(1,:);
End = MaxDDIndex(2,:);
(TestData(Start(1),1) - TestData(End(1),1))/TestData(Start(1),1)
ans =
0.1658
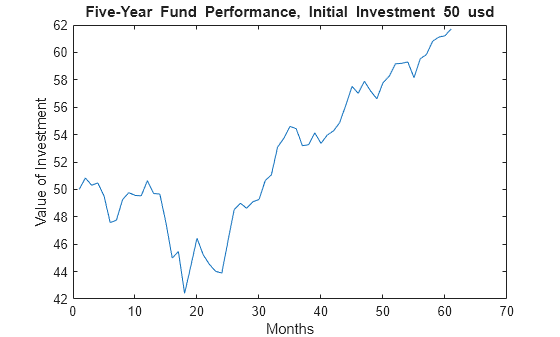
Although the maximum drawdown is measured in terms of returns, maxdrawdown can measure the drawdown in terms of absolute drop in value, or in terms of log-returns. To contrast these alternatives more clearly, you can work with the fund series assuming, an initial investment of 50 dollars.
Fund50 = 50*TestData(:,1);
plot(Fund50);
title('\bfFive-Year Fund Performance, Initial Investment 50 usd');
xlabel('Months');
ylabel('Value of Investment');
Compute the standard maximum drawdown, which coincides with the results above because returns are independent of the initial amounts invested.
MaxDD50Ret = maxdrawdown(Fund50)
MaxDD50Ret =
0.1658
Compute the maximum drop in value, using the arithmetic argument.
[MaxDD50Arith, Ind50Arith] = maxdrawdown(Fund50,'arithmetic')MaxDD50Arith = 8.4285
Ind50Arith = 2×1

     2
    18
The value of this investment is $50.84 in month 2, but by month 18 the value is down to $42.41, a drop of $8.43. This is the largest loss in dollar value from a previous high in the given time period. In this case, the maximum drawdown period, 2nd to 18th month, is the same independently of whether drawdown is measured as return or as dollar value loss.
Finally, you can compute the maximum decline based on log-returns using the geometric argument. In this example, the log-returns result in a maximum drop of 18.13%, again from the second to the 18th month, not far from the 16.58% obtained using standard returns.
[MaxDD50LogRet, Ind50LogRet] = maxdrawdown(Fund50,'geometric')MaxDD50LogRet = 0.1813
Ind50LogRet = 2×1

     2
    18
Note, the last measure is equivalent to finding the arithmetic maximum drawdown for the log of the series.
MaxDD50LogRet2 = maxdrawdown(log(Fund50),'arithmetic')MaxDD50LogRet2 = 0.1813
Expected Maximum Drawdown
This example shows how to use the log-return moments of the fund to compute the expected maximum drawdown (EMaxDD) and then compare it with the realized maximum drawdown (MaxDD).
load FundMarketCash
logReturns = log(TestData(2:end,:) ./ TestData(1:end - 1,:));
Mu = mean(logReturns(:,1));
Sigma = std(logReturns(:,1),1);
T = size(logReturns,1);

MaxDD = maxdrawdown(TestData(:,1),'geometric')
MaxDD =
0.1813
EMaxDD = emaxdrawdown(Mu, Sigma, T)
EMaxDD =
0.1545
The drawdown observed in this time period is above the expected maximum drawdown. There is no contradiction here. The expected maximum drawdown is not an upper bound on the maximum losses from a peak, but an estimate of their average, based on a geometric Brownian motion assumption.
See Also
sharpe | inforatio | portalpha | lpm | elpm | maxdrawdown | emaxdrawdown | ret2tick | tick2ret