show
Visualize dynamic evidential grid map
Description
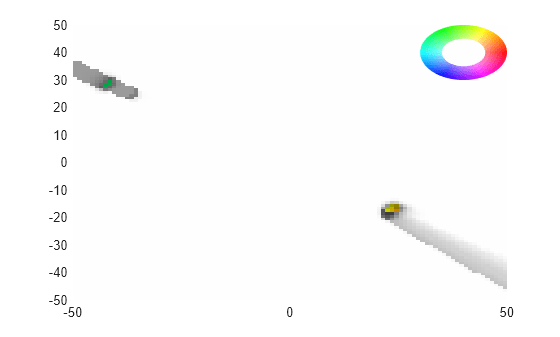
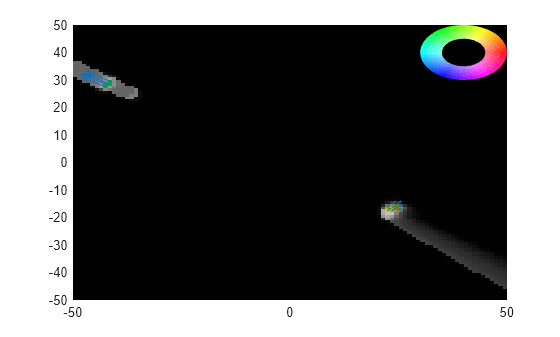
show( plots the dynamic occupancy grid map
in local coordinates. The static cells are shown using grayscale images, in which the
grayness represents the occupancy probability of the cell. The dynamic cells are shown using
HSV (hue, saturation, and value) values on an RGB colormap:map)
Hue — The orientation angle of the velocity vector divided by 360. As hue increases from 0 to 1, the color changes in the order of red to orange, yellow, green, cyan, blue, magenta, and back to red.
Saturation — The Mahalanobis distance (d) between the velocity distribution of the grid cell and the zero velocity. A cell with d > 4 is drawn with full saturation.
Value — The occupancy probability of the cell.
show(
specifies options using one or more name-value pair arguments. Enclose each Name in quotes.
For example, map,Name,Value)show(myMap,'PlotVelocity',true) plots the dynamic map for
myMap with velocity plotting enabled.
Examples
Load a dynamicEvidentialGridMap object from a data file.
load gridMapData.mat
map
map =
dynamicEvidentialGridMap with properties:
NumStateVariables: 4
MotionModel: 'constant-velocity'
GridLength: 100
GridWidth: 100
GridResolution: 1
GridOriginInLocal: [-50 -50]
Show the grid map.
figure
show(map)
Show the grid map with velocity plotted and color inverted.
figure
show(map,'PlotVelocity',true,'InvertColors',true)
Input Arguments
Name-Value Arguments
Extended Capabilities
Version History
Introduced in R2021a