Get Started with Spectral Image Labeler
The Spectral Image Labeler app enables you to label ground truth data in hyperspectral and multispectral images for applications such as pixel classification and semantic segmentation. Using the app, you can:
Load images stored in files or from the workspace.
Choose false color, RGB, CIR, or custom views of spectral images for ease of labeling.
Create multiple label definitions to label regions of interest. Label ROIs using built-in automatic and manual techniques.
Write, import, and use your own custom automation algorithm to automatically label ground truth data.
Export the labeled ground truth data as a
groundTruthSpectralImageobject. You can use this object to share labels with colleagues or to store ground truth labels for pixel classification or semantic segmentation.
Use the app to label hyperspectral or multispectral images for land-use/land-cover (LULC) classification, vegetation mapping, and change detection, or to label spectral images from lab or industrial settings for applications such as material identification and quality inspection.
This tutorial provides an overview of the capabilities of the Spectral Image Labeler. The typical app process includes these steps.
You can also label large spectral images that do not fit in memory using the Spectral Image Labeler app. For more information on labeling large spectral images, see Label Large Spectral Images in Spectral Image Labeler.
Open the Spectral Image Labeler App
Open the Spectral Image Labeler app from the Apps tab
on the MATLAB® Toolstrip, under Image Processing and Computer
Vision. You can also open the app by using the
spectralImageLabeler command.
Create, Save, or Open Labeling Session
The Spectral Image Labeler app creates a new session by default when you open the app. To save your in-progress work, save the app session as a MAT file by selecting Save Session on the Labeler tab of the app toolstrip.
To create and switch to a new app session, select New Session on the Labeler tab. To open an existing session, saved as a MAT file, and continue working, select Open Session on the Labeler tab.
Load Data
You can load spectral images, existing labels, and label definitions into the app.
Load Spectral Image
You can load spectral images into the app directly from files or from the workspace.
To load hyperspectral or multispectral images from files into the app, select
Import on the Labeler tab of the app toolstrip. Then, under From File, select File. In the
dialog box that opens, browse for the image file. The dialog box also enables you to
specify whether you want to import wavelengths for the image file from the file or
the workspace, or to import the image file without wavelength data. The app can load
hyperspectral and multispectral files supported by the imhypercube, geohypercube, immulticube, or geomulticube function.
To load spectral images present in the workspace as hypercube or multicube objects into the app, select Import on the Labeler tab of the
app toolstrip. Then, under From Workspace, select
Spectral Image. To load spectral images present
in the workspace as 3-D data arrays, select Import
on the Labeler tab. Then, under From Workspace, select Data
Array.
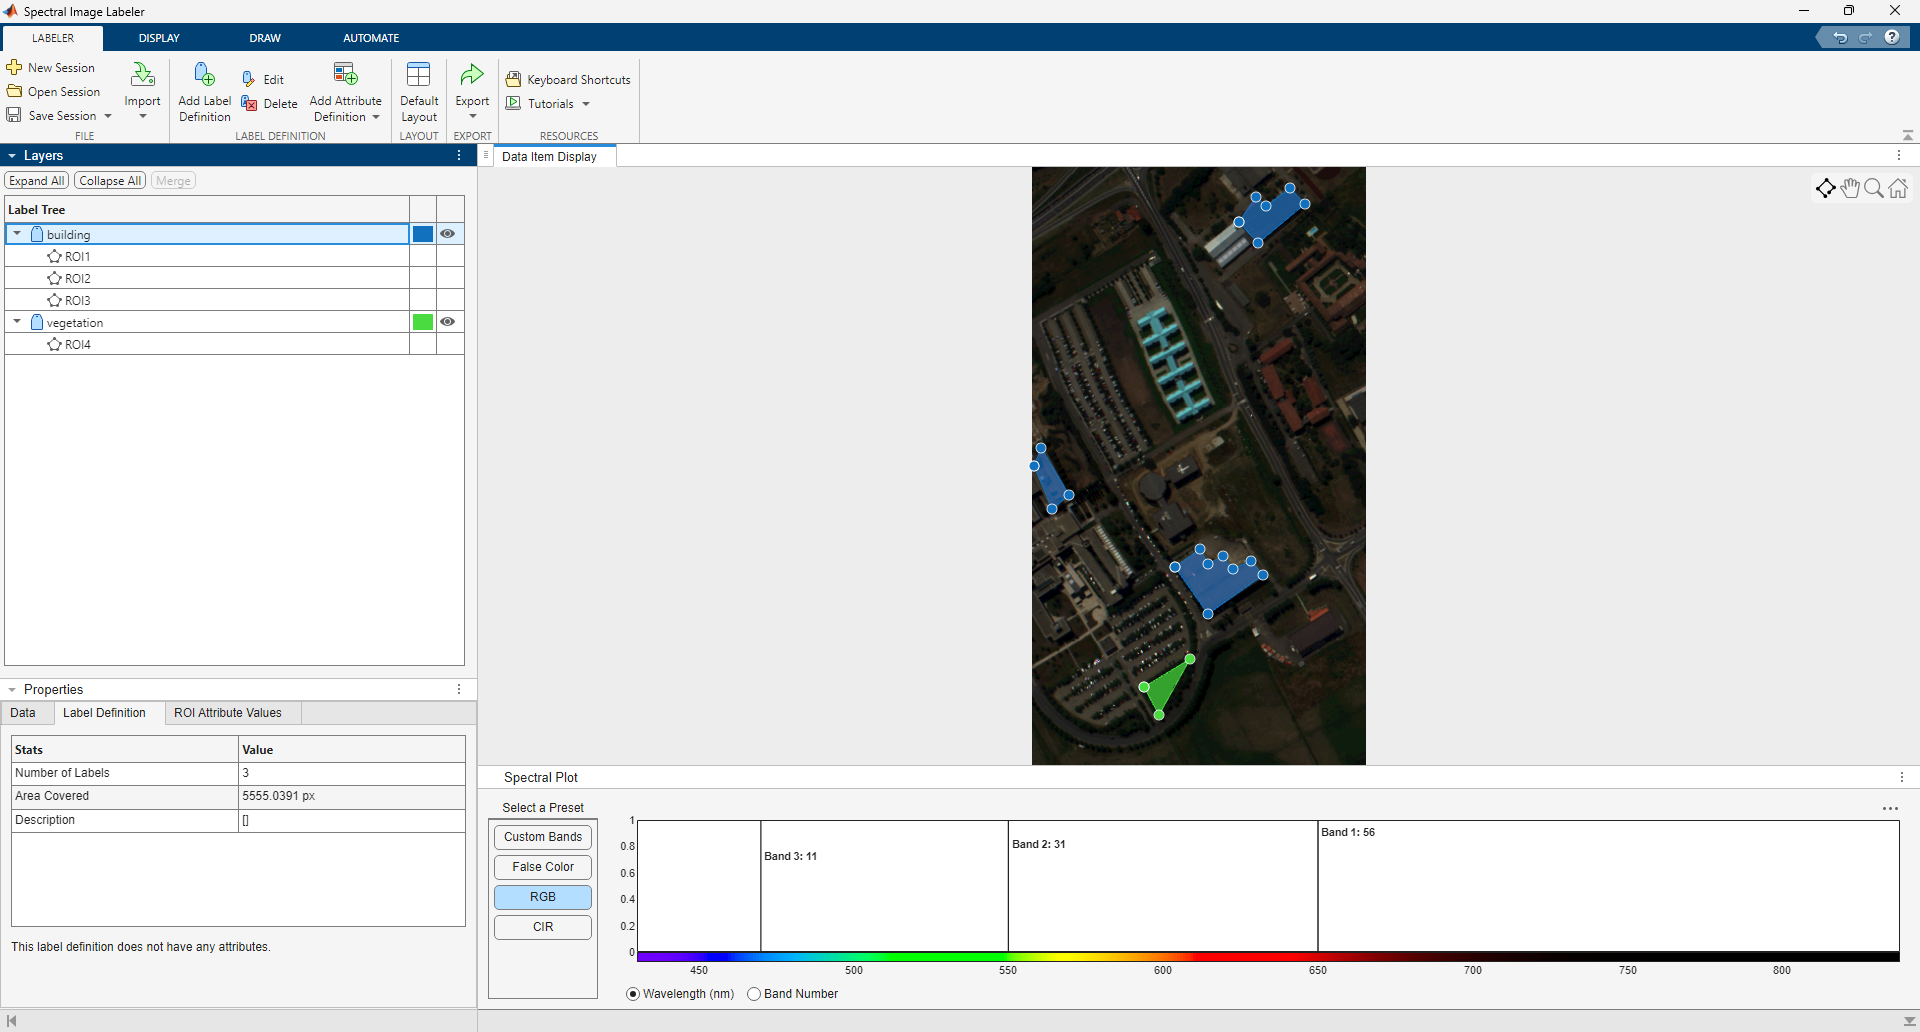
You can examine the details of the loaded spectral image in the Data tab of the Properties pane.
Load Labels
You can load existing labels stored as groundTruthSpectralImage objects, or labels saved in
.SHP shapefiles, into the app.
To load labels saved as groundTruthSpectralImage objects in MAT
files into the app, select Import on the Labeler tab of the app toolstrip. Then, under Labels, select Labels,
and then From File. To load labels stored as
groundTruthSpectralImage objects from the workspace into the
app, select Import. Then under Labels, select Labels,
and then From Workspace.
If the spectral image has geospatial information in the form of raster reference
data, you can load labels from shapefiles into the app. To import labels from
shapefiles into the app, you must have a Mapping Toolbox™ license. To load labels saved as .SHP shapefiles
into the app, select Import on the Labeler tab. Then, under Labels, select Shapefile. Make sure
that your machine is set to the same character encoding scheme as the data you are
importing from the shapefile. For example, if you are trying to import a shapefile
that contains Japanese characters, configure your machine to support the Shift-JIS
encoding scheme.
Load Label Definitions
You can load existing label definitions, saved as MAT files, into the app. To load
label definitions into the app from MAT files, select Import on the Labeler tab of the
app toolstrip. Then, under Labels, select Label Definitions. The label definitions in the MAT file
must be in the format supported by the labelDefs input argument of the groundTruthSpectralImage object.
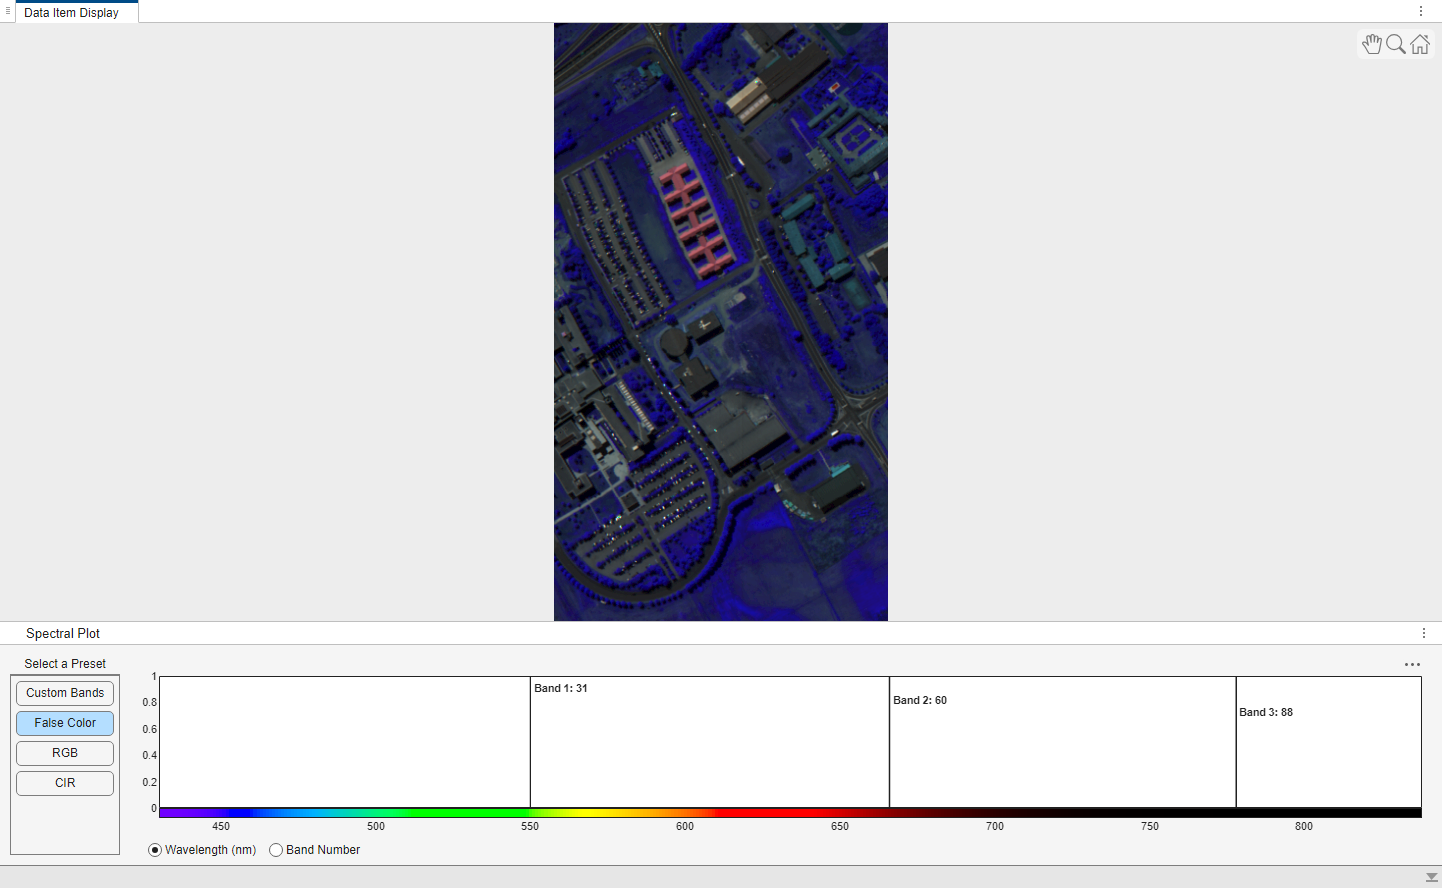
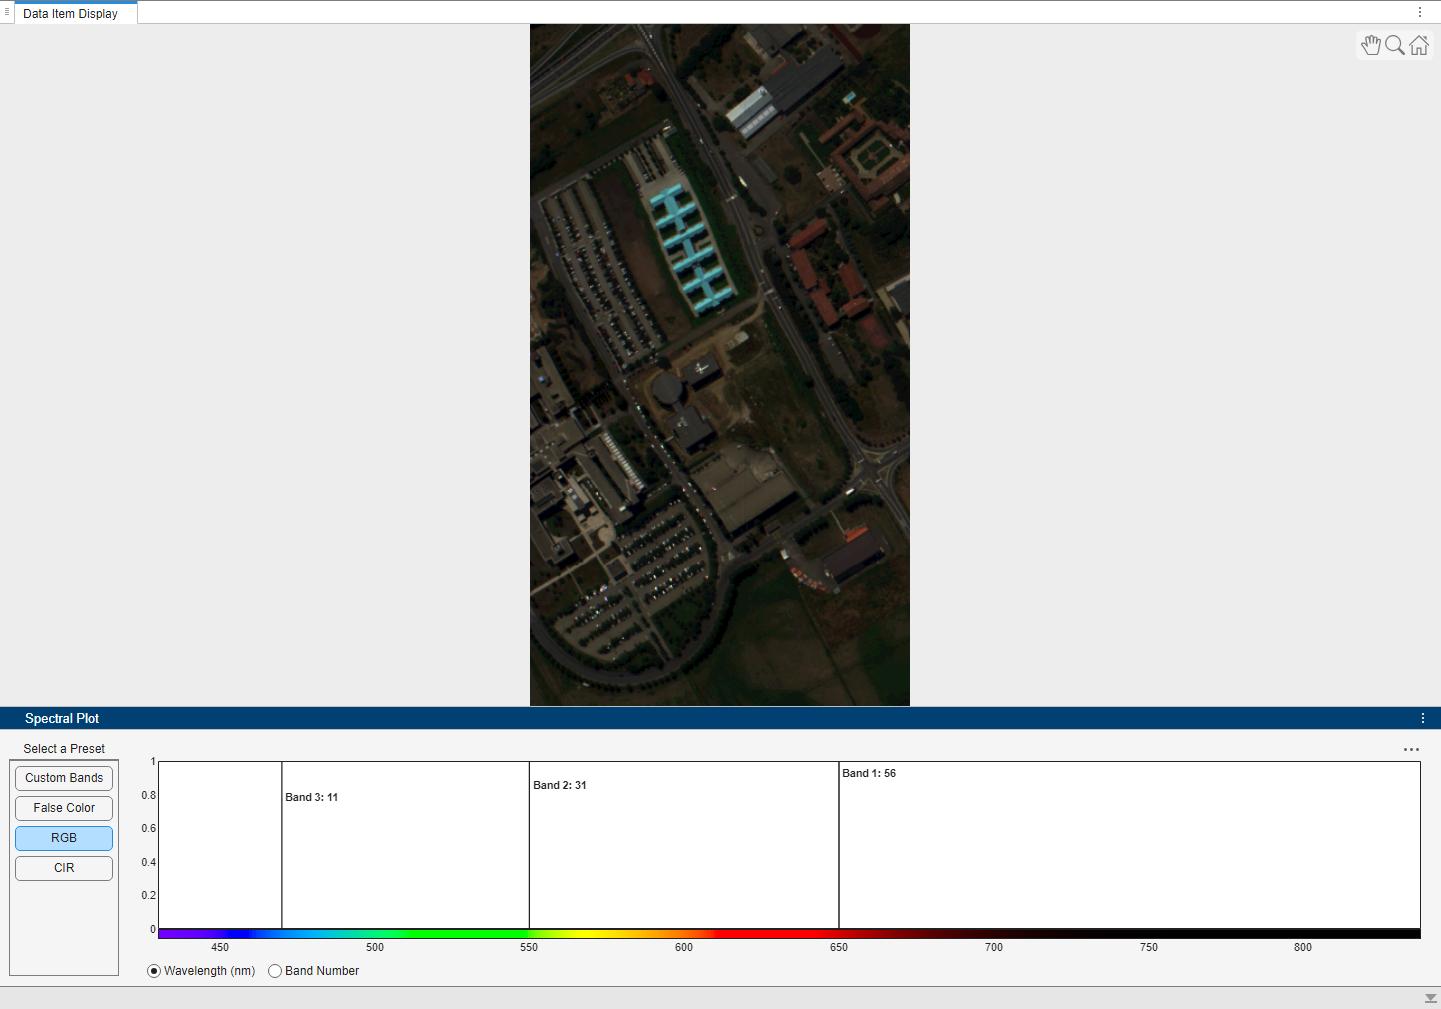
Visualize Data
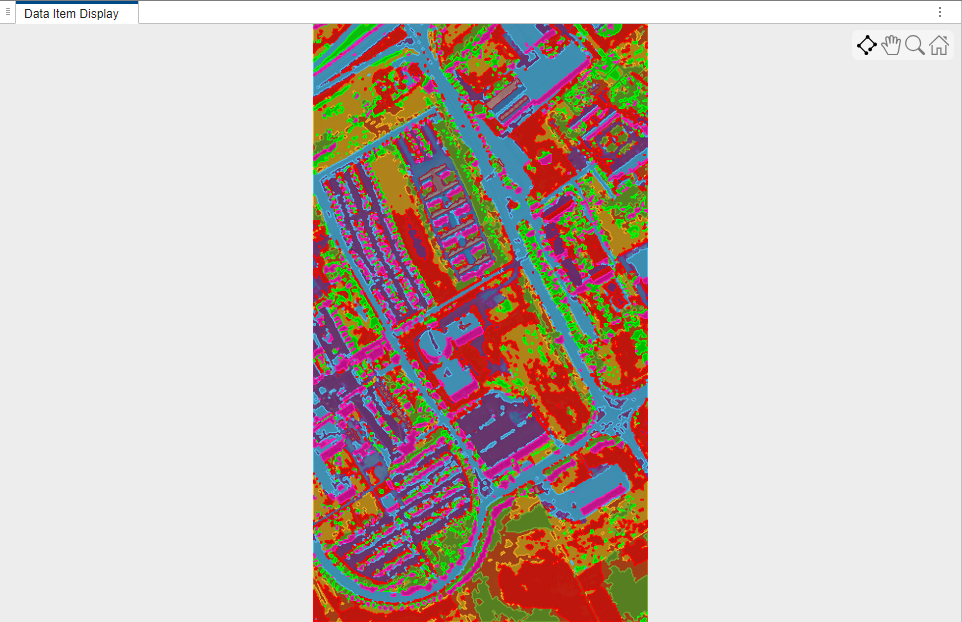
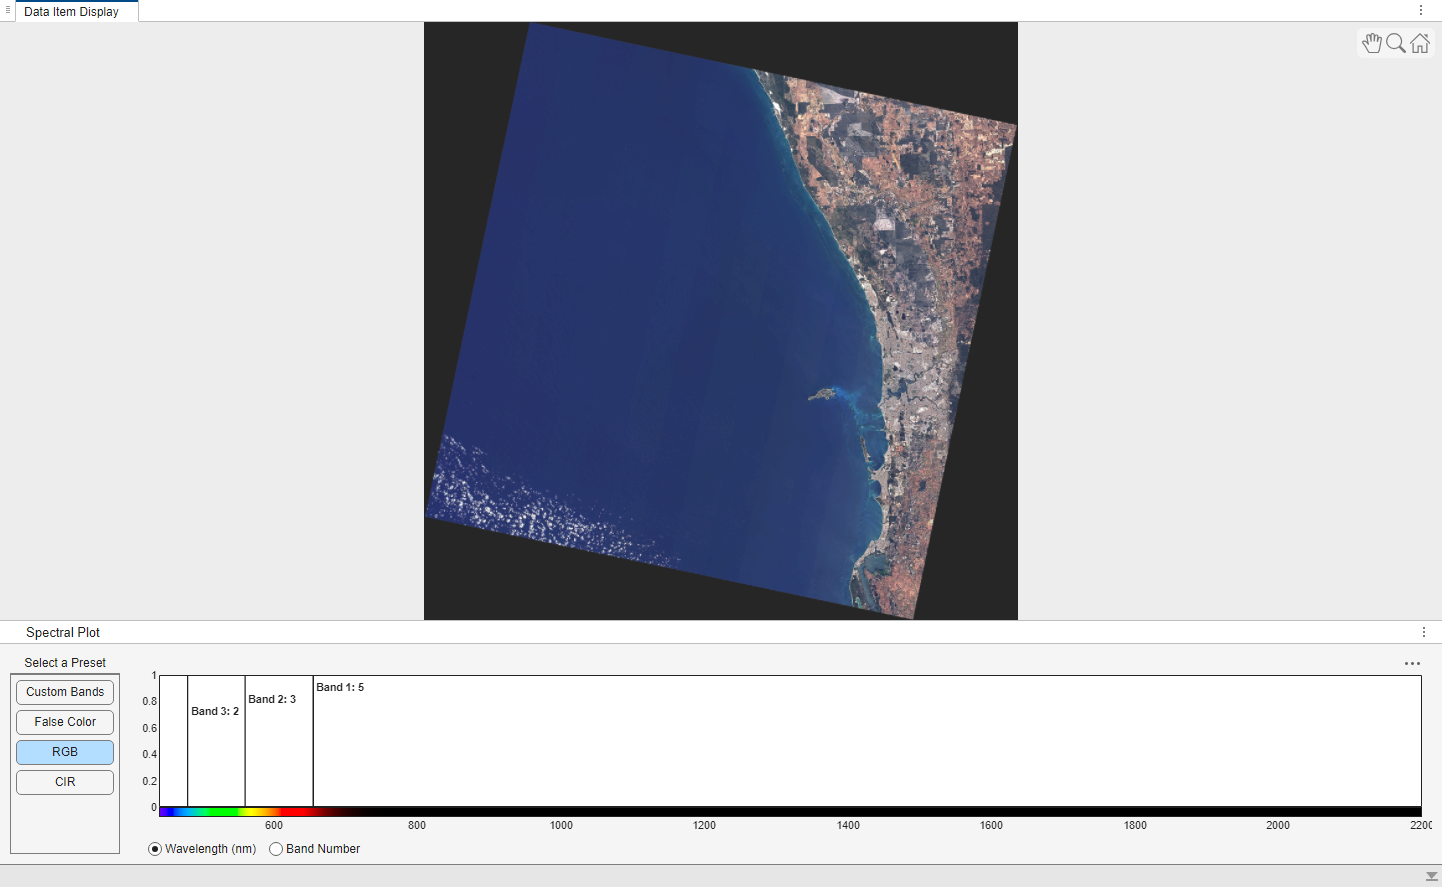
Once you load the spectral image into the app, you can select a color view for visualization that you find suitable for ease of labeling. In the Spectral Plots pane, you can select from the False Color, RGB, and CIR preset color views. You can also select a Custom Bands color view, and specify three custom bands for visualization. You can switch between different color views during the labeling session. You can also adjust the brightness, sharpness, and contrast of the visualization using the options in the Adjust section of the Display tab of the app toolstrip.
Create Label and Attribute Definitions
You can define labels by selecting Add Label
Definition on the Labeler tab of the app
toolstrip. In the dialog box that opens, define the label by specifying its name and
color. You can also add a description for the label. To group labels into categories,
you can also specify the group name while defining the label. You can use label groups
to organize several labels into a single category. For example, you can categorize
labels such as Grass and Trees into a group named
Vegetation, while categorizing Sea and
River into a group named WaterBodies. You can
also edit and delete created label definitions. To examine the details of the label
definition selected in the Label Tree, see the
Label Definition tab of the Properties pane.
An ROI attribute specifies additional information
about an ROI label. For example, for ROIs labeled Vegetation,
attributes might include the type of vegetation. You can define ROI attributes of these
types.
List— Specify a drop-down list attribute of predefined strings.Numeric— Specify a numeric scalar attribute.String— Specify a string scalar attribute.Logical— Specify a logical true or false attribute.
To add an attribute to a label, select the label definition in the Label Tree, and then either right-click on the label definition and select Add Attribute, or select Add Attribute Definition on the Labeler app of the app toolstrip. Then, select the type of ROI attribute to define. To specify the attributes for a specific ROI, select the ROI in the Label Tree or directly in the spectral image. Then, in the ROI Attribute Values tab of the Properties pane, specify the attribute values.
Names of labels, groups, and attributes must be valid MATLAB variable names. For more information about valid MATLAB variable names, see Variable Names.
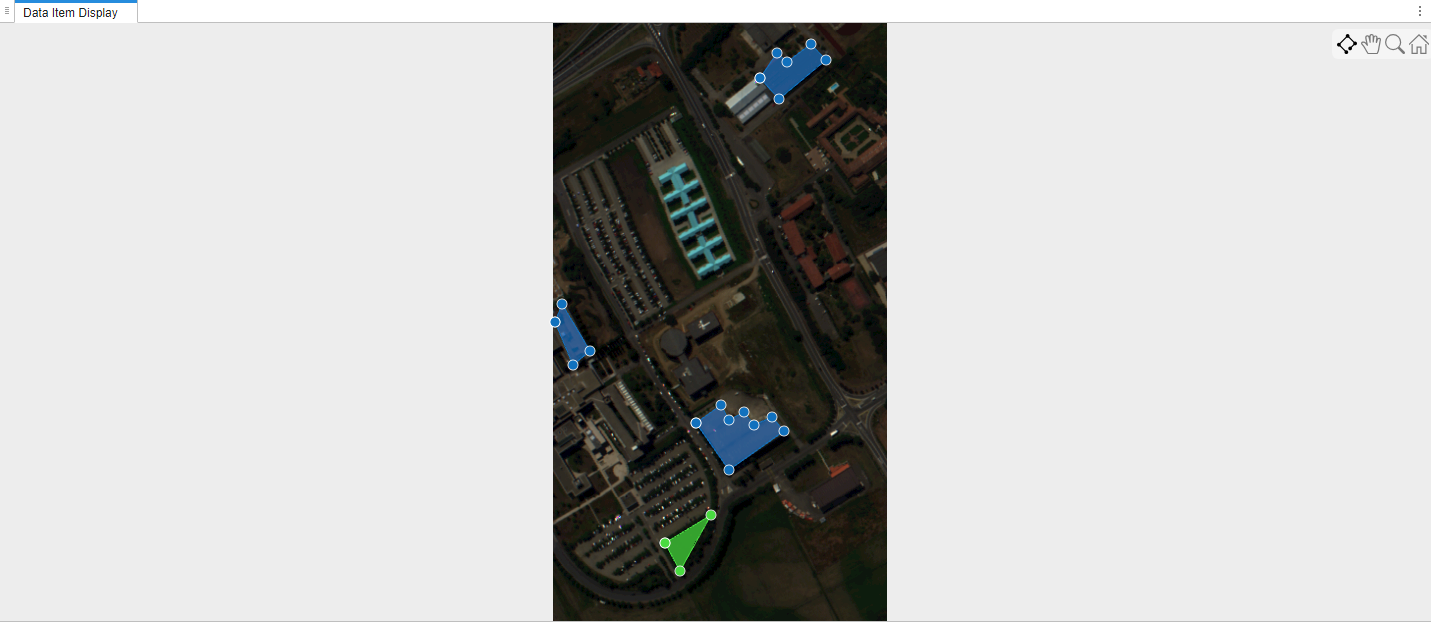
Label Data
Label regions of interest (ROIs) using the tools in the Draw and Automate tabs of the app toolstrip. The app provides manual and automated labeling tools.
Manual Labeling
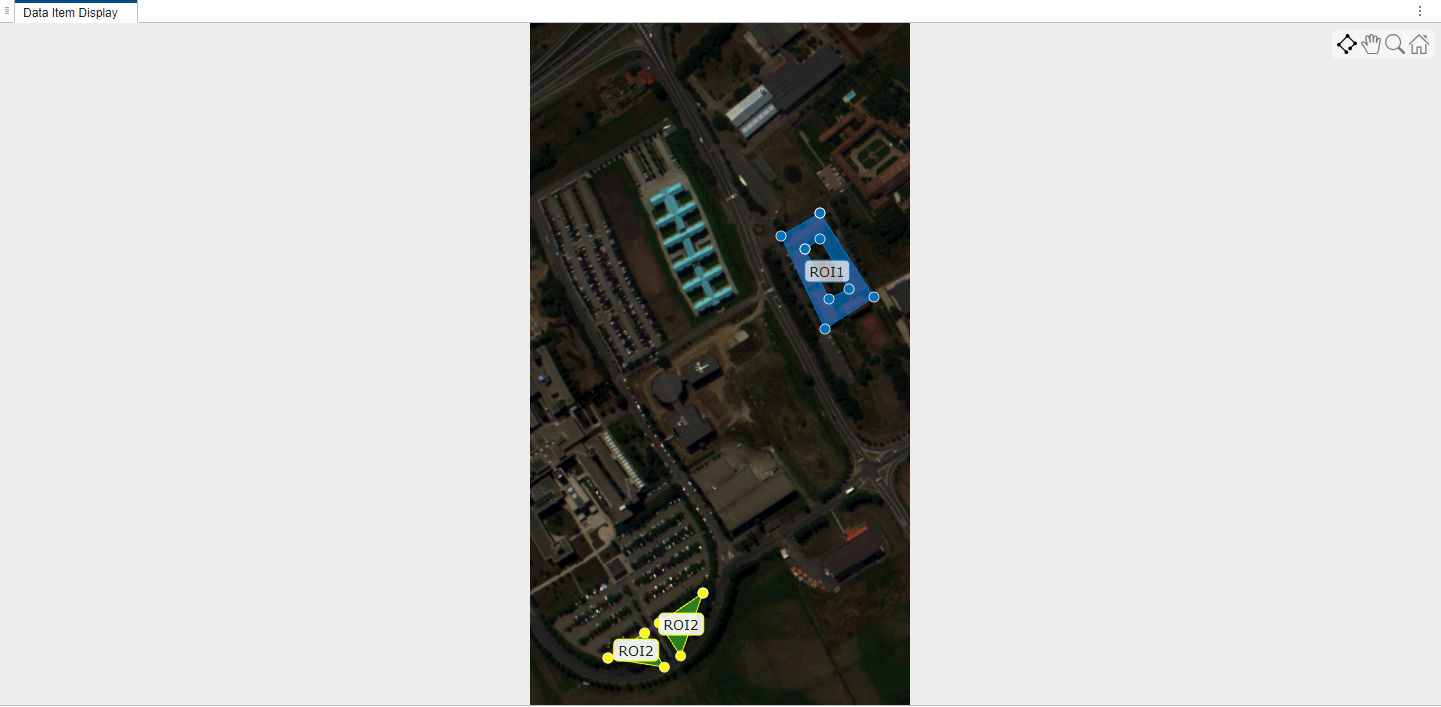
To manually label ROIs in the spectral image, select a label definition and, on the Draw tab of the app toolstrip, select Polygon. Draw a polygon shape by clicking the image to place each waypoint, which the tool connects with straight line edges. Press Backspace to remove the most recently added vertex and continue drawing. When you are finished, double-click or right-click to close the polygon shape and stop drawing. You can edit, rename, or delete the generated labels and ROIs in the Label Tree in the Layers pane. Names of ROIs must be valid MATLAB variable names. For more information about valid MATLAB variable names, see Variable Names.
To merge multiple ROIs, hold Ctrl and select the ROIs you want to merge either in the Label Tree or directly in the spectral image, and then select Merge in the Layers pane. To cut portions of ROIs, draw holes within ROIs, or split a large ROI into smaller ROIs, select Erase ROI on the Draw tab of the app toolstrip, and draw polygons in the spectral image to remove the regions you want erase. If you split an ROI into two using this feature, the app still considers the two parts of the ROI as merged in the Label Tree.
You can undo and redo these operations by using the Undo and Redo buttons, respectively, in the top-right corner of the app near the Help button.
Drawing an ROI
Moving an ROI
Moving vertices of an ROI
Erasing portions of an ROI
Deleting an ROI
Automated Labeling
You can perform automatic labeling of the spectral image using built-in or custom automation algorithms. The app provides these built-in automation algorithms for labeling.
Spectral Signature Based Algorithms:
Spectral Indices
ECOSTRESS Spectral Matching
Unsupervised Algorithms:
Anchor Graph Clustering
ISODATA Clustering
K-means Clustering
To perform automatic labeling using any of the built-in algorithms, perform these steps.
Select the algorithm from the Algorithms section of the Automate tab of the app toolstrip.
To learn about the algorithm and its parameters, select Algorithm Instruction on the Automate tab.
Configure the algorithm parameters by selecting Algorithm Parameters on the Automate tab.
Run the algorithm and generate labels by selecting Run on the Automate tab.
You can edit, rename or delete the generated labels and ROIs in the Label Tree within the Layers pane. Names of ROIs must be valid MATLAB variable names. For more information about valid MATLAB variable names, see Variable Names. To revert the changes, select Undo Run on the Automate tab.
You can also define and use your own custom automation algorithm in the Spectral Image Labeler app. For more information, see the Segment Hyperspectral Image Using Segment Anything Model in Spectral Image Labeler example.
Visualize Labels
After labeling the ROIs in the spectral image, you can use the different options in the Display tab of the app toolstrip for better visualization of the labels. You can choose whether to keep the names of the ROIs visible always, never, on hover, or only for the selected ROI by using the Select ROI Labels option. You can also adjust the opacity of the labels by using the Opacity option.
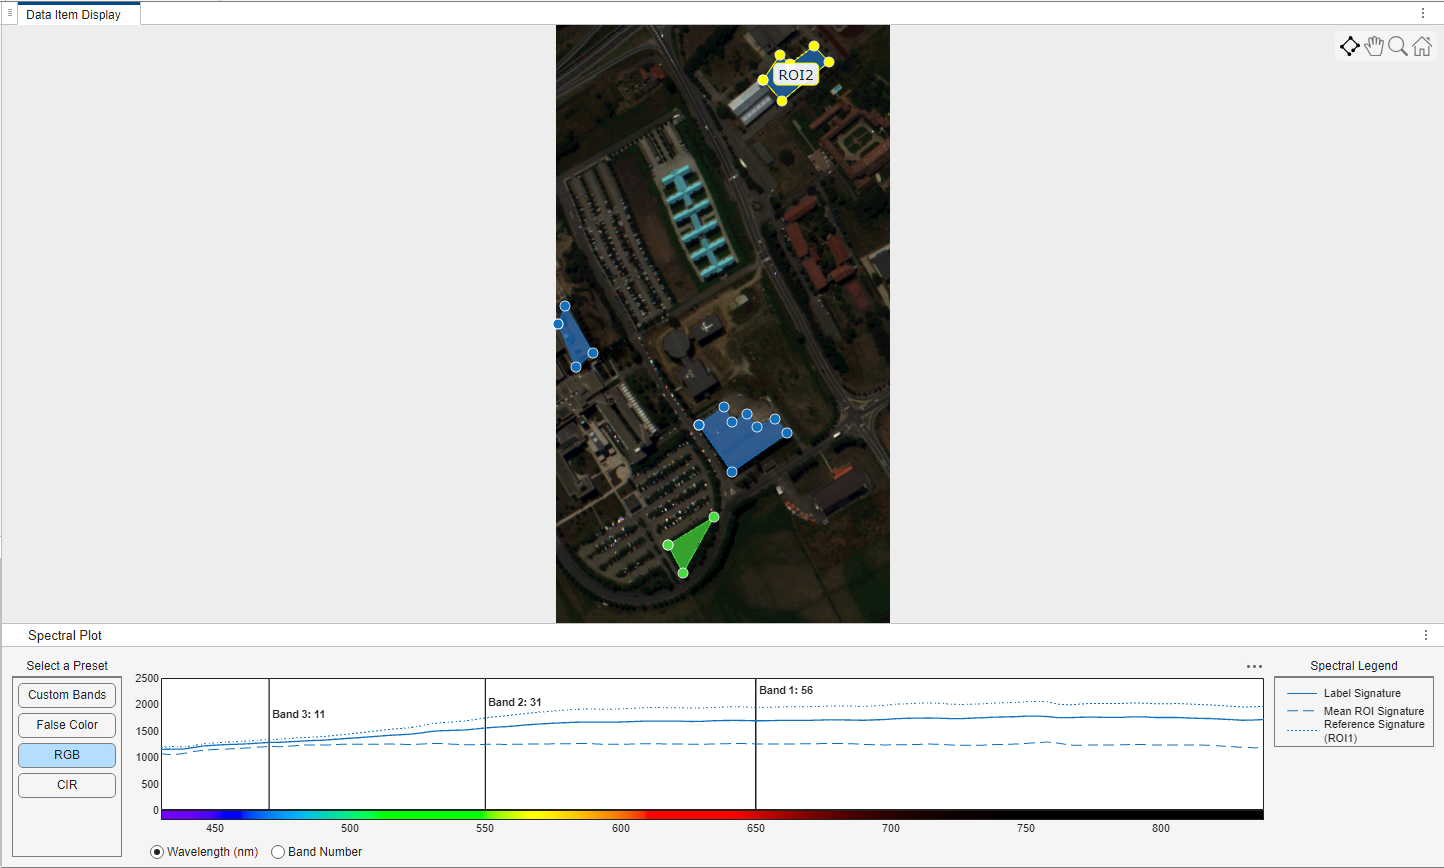
To examine the spectral signatures of the labeled ROIs, select Show Signature. When you select this option, the app shows the mean spectral signature of the selected ROI as the Mean ROI Signature in the Spectral Plots pane. The app also shows the mean spectral signature of all the ROIs with the same label as the Label Signature in the spectral plot. To compare spectral signatures of other ROIs to a reference ROI, select the reference ROI, select Show Signature, and then select Mark ROI as Reference. The spectral signature of the reference ROI is then visible in the spectral plot as the Reference Signature until you repeat the process for a new reference ROI.
Export Ground Truth Data
After labeling the ROIs in the spectral image, you can export the labels and label definitions and save them for future use.
Export Labels
To export the labels as a groundTruthSpectralImage object, gTruth, to a MAT
file, select Export on the Labeler tab of the app toolstrip. Then under Labels, select To File. To export
the groundTruthSpectralImage object to workspace, select To Workspace under Labels. You can use the groundTruthSpectralImage
object to share labels with colleagues. When sharing the
groundTruthSpectralImage object, you must also share the
corresponding data source file.
To export the labels as a .TIF file, select Export on the Labeler
tab. Then under Labels, select To Image File. If the spectral image contains geospatial
information, you can export the labels as an .SHP shapefile by
selecting To Shapefile under Labels. When exporting the labels as a shapefile, all of the related
files have the same base name. For example, if you specify filename as
mylabels.shp, then the app creates the related files
mylabels.shp, mylabels.shx,
mylabels.dbf, and mylabels.prj. To export
labels from the app to shapefiles, you must have a Mapping Toolbox license.
Export Label Definitions
To export the label definitions as a table, labelDefTable, to a
MAT file, select Export on the Labeler tab of the app toolstrip. Then under Label Definitions, select To
File.
Label Large Spectral Images in Spectral Image Labeler
The Spectral Image Labeler app enables you to label large spectral images that are too large to fit into memory. If you import a large spectral image into the app, the app provides the option to import it as a blocked image.
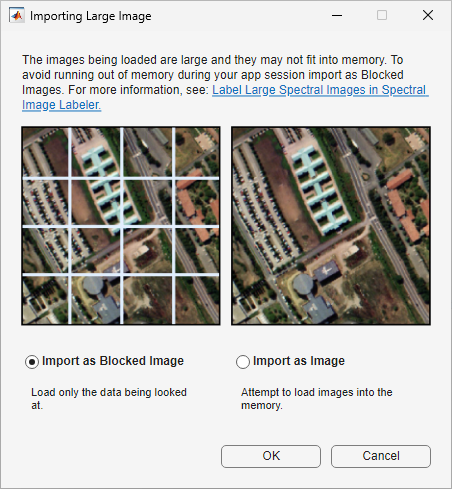
A blocked image divides the large image into smaller blocks that can each fit in memory, and processes the whole image in a block-by-block manner. You can visualize and manually label a blocked image like any other image.
Limitations
Visualizing spectral signatures is not supported for blocked images.
Automated labeling is not supported for blocked images.