assignData
Assign new data to spectral image data cube
Description
Add-On Required: This feature requires the Hyperspectral Imaging Library for Image Processing Toolbox add-on.
newspcube = assignData(spcube,row,column,band,data)data to a hyperspectral or multispectral data
cube. The function reads the data cube stored in the hypercube or
multicube object spcube, assigns the new data to
the spectral bands band at the locations specified by
row and column, and returns a new
hypercube or multicube object.
Note
The Hyperspectral Imaging Library for Image Processing Toolbox™ requires desktop MATLAB®, as MATLAB Online™ and MATLAB Mobile™ do not support the library.
Examples
Read hyperspectral data from an ENVI format file.
hcube = imhypercube("paviaU.dat");Normalize the reflectance values to the range [0, 1].
datacube = gather(hcube);
data = rescale(datacube);
Assign the normalized reflectance values to the data cube.
newhcube = assignData(hcube,":",":",":",data);
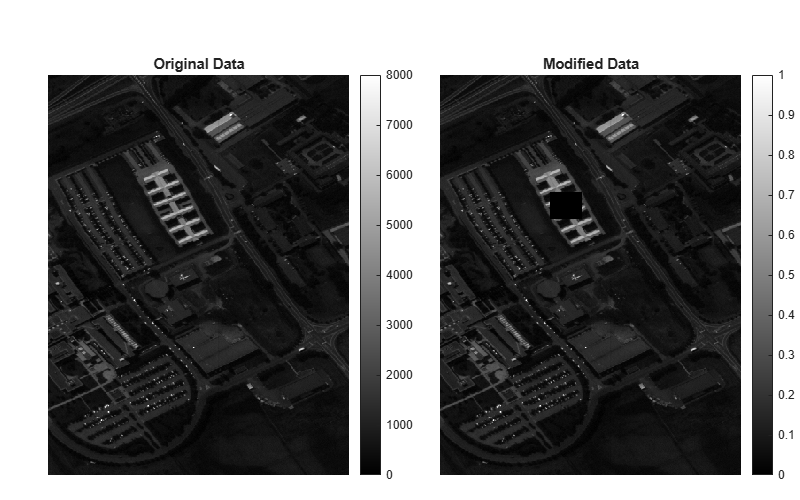
Specify the row and column indices of a region of interest (ROI). Assign all indices within the ROI a value of zero.
row = 180:220;
column = 125:160;
newhcube = assignData(newhcube,row,column,":",0);
newdatacube = gather(newhcube);
Display the original and the modified versions of a spectral band.
fig = figure(Position=[0 0 800 500]);
axes1 = axes(Parent=fig,Position=[0.06 0.05 0.45 0.8]);
imagesc(datacube(:,:,10),Parent=axes1);
title("Original Data")
colorbar
axis off
axes2 = axes(Parent=fig,Position=[0.55 0.05 0.45 0.8]);
imagesc(newdatacube(:,:,10),Parent=axes2);
title("Modified Data")
colorbar
axis off
colormap gray
Download Landsat 8 multispectral data.
zipfile = "LC08_L1TP_113082_20211206_20211215_02_T1.zip";
landsat8Data_url = "https://ssd.mathworks.com/supportfiles/image/data/" + zipfile;
hyper.internal.downloadLandsatDataset(landsat8Data_url,zipfile)
filepath = fullfile("LC08_L1TP_113082_20211206_20211215_02_T1","LC08_L1TP_113082_20211206_20211215_02_T1_MTL.txt");
Read a multispectral image into the workspace, and resample it to a uniform resolution..
mcube = immulticube(filepath);
mcube = resampleBands(mcube,30);
datacube = gather(mcube);
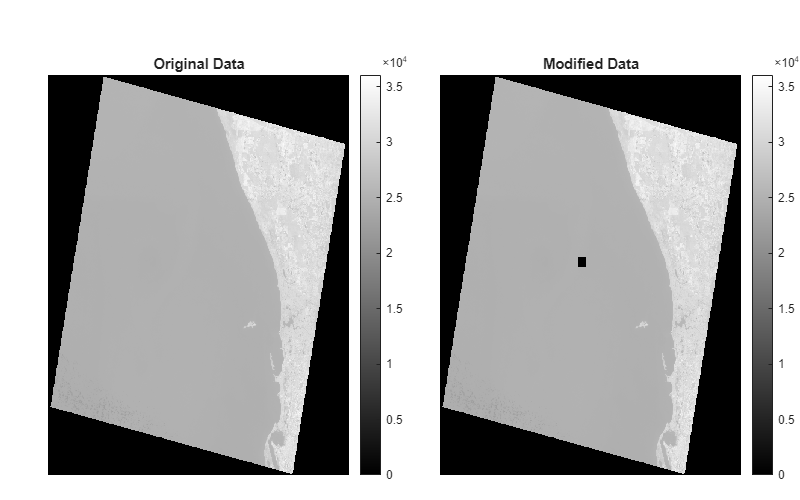
Specify the row and column indices of a region of interest (ROI). Assign all indices within the ROI a value of zero.
row = 3500:3700;
column = 3500:3700;
bands = 7:10;
newmcube = assignData(mcube,row,column,bands,0);
newdatacube = gather(newmcube);
Display the original and the modified versions of a spectral band.
fig = figure(Position=[0 0 800 500]);
axes1 = axes(Parent=fig,Position=[0.06 0.05 0.45 0.8]);
imagesc(datacube(:,:,10),Parent=axes1);
title("Original Data")
colorbar
axis off
axes2 = axes(Parent=fig,Position=[0.55 0.05 0.45 0.8]);
imagesc(newdatacube(:,:,10),Parent=axes2);
title("Modified Data")
colorbar
axis off
colormap gray
Input Arguments
Output Arguments
Version History
Introduced in R2020a
See Also
hypercube | multicube | removeBands | selectBands | cropData