Reference Raster Data Using Geographic or World Limits
Many Mapping Toolbox™ functions that analyze or display raster data require you to specify the data using an array of data values and a raster reference object. A raster reference object enables MATLAB® to associate each element of the array with a location in geographic or planar coordinates.
For many geospatial file formats, you can use Mapping Toolbox functions to import the referencing information into the workspace as a raster reference object. For a list of supported file formats, see Supported Geospatial File Formats for Import and Export.
If your data file does not contain referencing information, but you know the
geographic or world limits of the data, then you can manually create the reference
object using the georefcells, georefpostings,
maprefcells, or maprefpostings
function.
Choose a Creation Function
The creation function you use to create the raster reference object depends on the characteristics of the raster data.
georefcells— The raster is a grid of quadrangular cells referenced to geographic latitude and longitude coordinates.georefpostings— The raster is a grid of posting point samples referenced to geographic coordinates.maprefcells— The raster is a grid of rectangular cells referenced to projected world x- and y-coordinates.maprefpostings— The raster is a grid of posting point samples referenced to projected coordinates.
Differentiate Between Cells and Postings
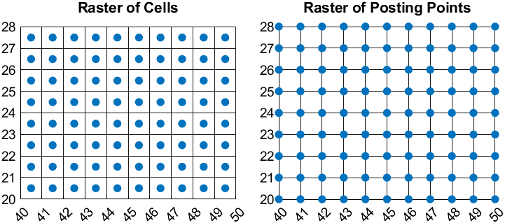
This image shows differences between a projected raster of cells and a projected raster of posting points. Both rasters have elements that are spaced 1 meter apart, with the raster covering x-values in the range [40,50] in meters and y-values in the range [20,28] in meters. The raster of cells is 8-by-10 and the raster of postings is 9-by-11. The boundary of the raster of cells is made up of the outermost boundaries of the outermost cells and the boundary of the raster of postings is made up of sampling points along the edges of the raster.
If you do not know whether your raster is a grid of cells or a grid of posting points, you can try the following:
Ask your data provider.
Search the metadata for information about the spatial registration or interpretation of the data. Metadata for rasters of cells can contain phrases such as "pixels" or "pixel is area." Metadata for rasters of posting points can contain phrases such as "grid", "node", or "pixel is point."
Consider what the data represents. Images are typically made of cells, while elevation grids are typically made of posting points.
Consider the size of the raster. If the dimensions of the raster are round numbers, such as a raster of size
[1000 1000], then the raster is probably made of cells. If the dimensions of the raster are round numbers plus one, such as a raster of size[1001 1001], then the raster is probably made of posting points.
Create Reference Object for Image
This example shows how to import an image, create a reference object for the image, then display the image on a map.
Read an image into the workspace as an array by using the imread function. The array is of size 500-by-500-by-3 and specifies the red, green, and blue components of the image.
A = imread("boston_common.jpg");To create a reference object for the image, you must determine the following:
Whether the image is referenced to geographic or projected coordinates
Whether the image is made up of cells or posting points
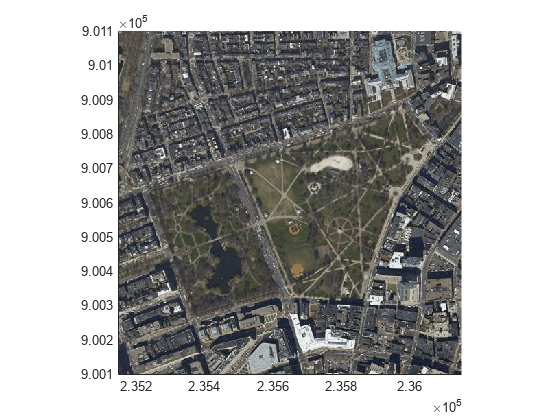
Information included in the file boston_common.txt indicates that the image is referenced to projected coordinates and is made up of cells. Therefore, you can create a reference object by using the maprefcells function. Specify the x- and y-limits, also included in the file boston_common.txt, using world coordinates.
xlimits = [235150 236150];
ylimits = [900100 901100];
R = maprefcells(xlimits,ylimits,size(A));
Information included in the file boston_common.txt indicates that the coordinates are referenced to the NAD83 / Massachusetts Mainland coordinate reference system (CRS), which has the EPSG authority code 26986. Create a projected CRS object and set the ProjectedCRS property of the reference object.
proj = projcrs(26986);
R.ProjectedCRS = proj;
Define the first row of A as the northernmost edge of the image by setting the ColumnsStartFrom property of the reference object to "north". Otherwise, the ColumnsStartFrom property defaults to "south".
R.ColumnsStartFrom = "north"; Display the image over a basemap by using the geoimage function. Note that the streets in the basemap align with the streets in the image.
figure
geoimage(A,R)
The data used in this example is derived from data provided by MassGIS (Bureau of Geographic Information). See the file boston_common.txt for more details.
Create Reference Object for Elevation Grid
This example shows how to import elevation data, create a reference object for the data, then display the data on an axesm-based map.
Load elevation data as an array.
load elevation_n39_w106.matTo create a reference object for the data, you must determine the following:
Whether the data is referenced to geographic or projected coordinates
Whether the data is made of cells or posting points
Information in the file elevation_n39_w106.txt indicates that the data set is referenced to geographic coordinates and is made up of posting points. Therefore, you can create a reference object by using the georefpostings function. Specify the latitude and longitude limits, also included in the file boston_common.txt, using degrees.
latlim = [39 40];
lonlim = [-106 -105];
R = georefpostings(latlim,lonlim,size(elevation_n39_w106));
Display the data over satellite imagery by using the geopcolor function. Apply a colormap appropriate for elevation data by using the demcmap function.
figure
geobasemap satellite
geopcolor(elevation_n39_w106,R)
demcmap(elevation_n39_w106)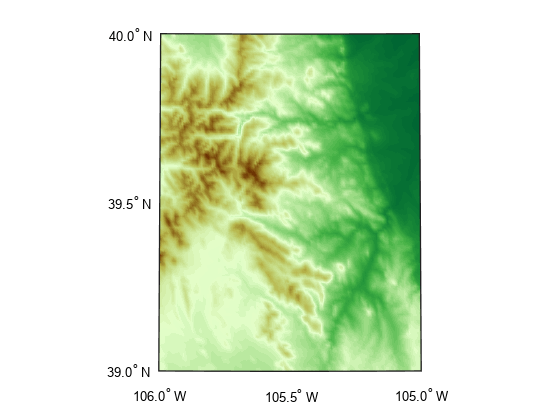
The data set used in this example is derived from data provided by the U.S. Geological Survey. See the file elevation_n39_w106.txt for more details.