Work with Objects by Name
You can manipulate displayed map objects by name. Many Mapping Toolbox™ functions assign descriptive names to the Tag
property of the objects they create. The namem and related functions
allow you to control the display of groups of similarly named objects, determine the
names and change them if desired, and use the name in the set and
get functions.
Some mapping display functions like framem, gridm, and contourm assign object tags by default. You can also set the name upon
display by assigning a value to the Tag property in mapping display
functions that use property name/property value pairs. If the Tag
does not contain a value, the name defaults to an object's Type
property, such as 'line' or 'text'.
Manipulate Displayed Map Objects By Name
This example shows how to manipulate objects displayed on axesm-based maps by name. Many functions assign descriptive names to the Tag property of the objects they create. The namem and related functions allow you to control the display of groups of similarly named objects, determine the names and change them, if desired, and use the name in calls to get and set.
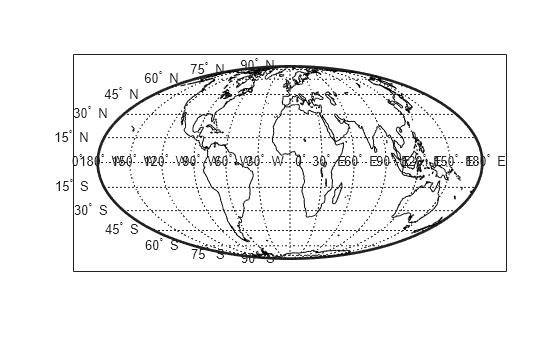
Display a vector map of the world.
f = axesm('fournier')f =
Axes with properties:
XLim: [0 1]
YLim: [0 1]
XScale: 'linear'
YScale: 'linear'
GridLineStyle: '-'
Position: [0.1300 0.1100 0.7750 0.8150]
Units: 'normalized'
Show all properties
framem on;
gridm on;
plabel on;
mlabel('MLabelParallel',0)
load coastlines
plotm(coastlat,coastlon,'k','Tag','Coastline')
List the names of the objects in the current axesm-based map using namem.
namem
ans = 6×9 char array
    'PLabel   '
    'MLabel   '
    'Parallel '
    'Meridian '
    'Coastline'
    'Frame    '
Use handlem to get the handles to the graphics objects displayed on an axesm-based map. You use these handles to get or set object properties. For example, change the line width of the coastline with set. If you call handlem with no arguments, it opens a graphical user interface that lists all the objects on the map. You can select objects interactively.
set(handlem('Coastline'),'LineWidth',2)

Change the colors of the meridian and parallel labels separately.
set(handlem('Mlabel'),'Color',[.5 .2 0])
set(handlem('Plabel'),'Color',[.2 .5 0])

Change the color of the labels to be the same.
setm(f,'fontcolor', [.4 .5 .6])
Use handlem specifying the 'all' modifier to get a list of all text objects or all line objects.
t = handlem('alltext')t = 26×1 Text array: Text (PLabel) Text (PLabel) Text (PLabel) Text (PLabel) Text (PLabel) Text (PLabel) Text (PLabel) Text (PLabel) Text (PLabel) Text (PLabel) Text (PLabel) Text (PLabel) Text (PLabel) Text (MLabel) Text (MLabel) Text (MLabel) Text (MLabel) Text (MLabel) Text (MLabel) Text (MLabel) Text (MLabel) Text (MLabel) Text (MLabel) Text (MLabel) Text (MLabel) Text (MLabel)
l = handlem('allline')l = 3×1 Line array: Line (Parallel) Line (Meridian) Line (Coastline)