Manipulating Axes Aspect Ratio
Axes Aspect Ratio Properties
The axis command works by setting
various axes object properties. You can set these properties directly to achieve
precisely the effect you want.
Property | Description |
|---|---|
DataAspectRatio | Sets the relative scaling of the individual axis data
values. Set Set with |
DataAspectRatioMode | In |
PlotBoxAspectRatio | Sets the proportions of the axes plot box (set
Set with |
PlotBoxAspectRatioMode | In |
Position | Defines the location and size of the axes with a four-element vector: [left offset, bottom offset, width, height]. |
XLim, YLim,
ZLim | Sets the minimum and maximum limits of the respective axes. |
 XLimMode ,
YLimMode , ZLimMode | In |
When the mode properties are set to auto, MATLAB automatically determines values for all of these properties and then
stretches the axes to fit the figure shape. You can override any property's
automatic operation by specifying a value for the property or setting its mode
property to manual.
The value you select for a particular property depends primarily on what type of data you want to display. Much of the data visualized with MATLAB is either
Numerical data displayed as line, mesh plots, or other specialized plot
Representations of real-world objects (e.g., a motor vehicle or a section of the earth's topography)
In the first case, it is generally desirable to select axis limits that provide good resolution in each axis direction and to fill the available space. Real-world objects, on the other hand, need to be represented accurately in proportion, regardless of the angle of view.
The MATLAB default property values are designed to
Select axis limits to span the range of the data (when
XLimMode,YLimMode, andZLimModeare set toauto).Provide the highest resolution in the available space by setting the scale of each axis independently (when
DataAspectRatioModeand thePlotBoxAspectRatioModeare set toauto).Draw axes that fit the position rectangle by adjusting the
CameraViewAngleand then stretch-to-fill the axes if necessary.
Default Aspect Ratio Selection
The axes Position property specifies the location and dimensions of the axes within the figure. The third and fourth elements of the Position vector (width and height) define a rectangle in which MATLAB draws the axes. MATLAB fits the axes to this rectangle.
The default value for the axes Units property is normalized to the parent figure dimensions. This means the shape of the figure window determines the shape of the position rectangle. As you change the size of the figure window, MATLAB reshapes the position rectangle to fit it.
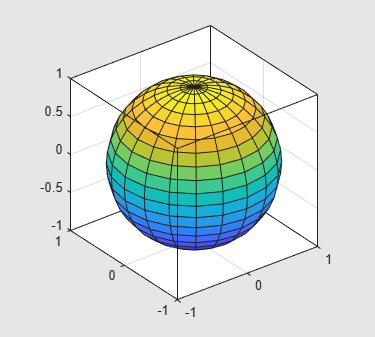
sphere
set(gcf,'Color',[0.90 0.90 0.90])
set(gca,'BoxStyle','full','Box','on')
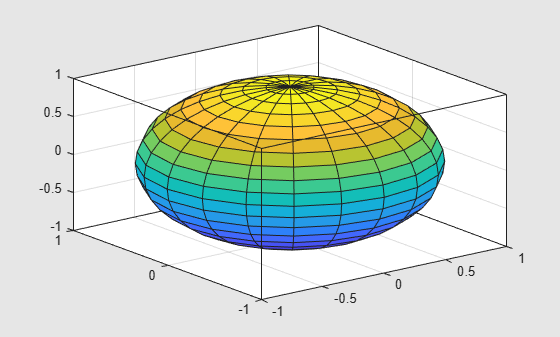
Changing the size and shape of the figure causes a change in the size and shape of the axes. The axes might select new axis tick mark locations as well.
f = gcf;
f.Position(3) = f.Position(3) * 0.67;
Reshaping the axes to fit into the figure window can change the aspect ratio of the graph. MATLAB fits the axes to fill the position rectangle and in the process can distort the shape. This is generally desirable for graphs of numeric data, but not for displaying objects realistically.
Maintaining the Axes Proportions with Figure Resize
To maintain a particular shape, you can specify the size of the axes in absolute units such as inches, which are independent of the figure window size. However, this is not a good approach if you are writing a MATLAB program that you want to work with a figure window of any size. A better approach is to specify the aspect ratio of the axes and override automatic stretch-to-fill.
In cases where you want a specific aspect ratio, you can override stretching by specifying a value for these axes properties:
DataAspectRatioorDataAspectRatioModePlotBoxAspectRatioorPlotBoxAspectRatioModeCameraViewAngleorCameraViewAngleMode
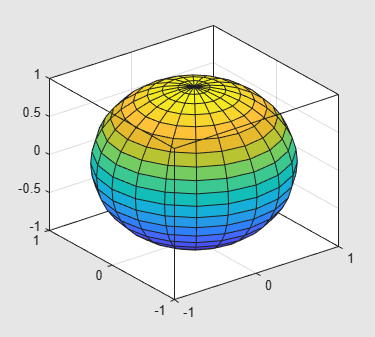
The first two sets of properties affect the aspect ratio directly. Setting either of the mode properties to manual simply disables stretch-to-fill while maintaining all current property values. In this case, MATLAB enlarges the axes until one dimension of the position rectangle constrains it. For example, set the DataAspectRatio to [1 1 1]. Also set the figure's color to see the relationship between the figure and the axes.
sphere
daspect([1 1 1])
set(gca,'BoxStyle','full','Box','on')
set(gcf,'Color',[0.90 0.90 0.90])
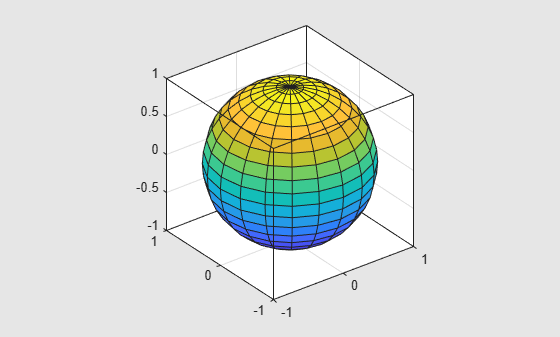
Changing the size and shape of the figure does not change the aspect ratio of the axes.
f = gcf;
f.Position(3) = f.Position(3) * 0.67;
Setting the CameraViewAngle property disables stretch-to-fill, and also prevents MATLAB from readjusting the size of the axes if you change the view.
Aspect Ratio Properties
It is important to understand how properties interact with each other, in order to obtain the results you want. The DataAspectRatio, PlotBoxAspectRatio, and the x-, y-, and z-axis limits (XLim, YLim, and ZLim properties) all place constraints on the shape of the axes.
Data Aspect Ratio
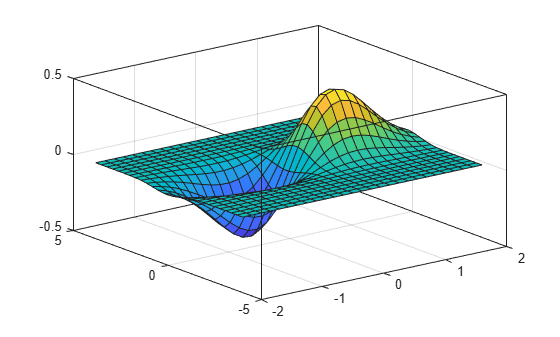
The DataAspectRatio property controls the ratio of the axis scales. For example, to display a surface plot of a mathematical expression MATLAB selects a data aspect ratio that emphasizes the function’s values:
[X,Y] = meshgrid((-2:.15:2),(-4:.3:4));
Z = X.*exp(-X.^2 - Y.^2);
surf(X,Y,Z)
set(gca,'BoxStyle','full','Box','on')
The daspect function returns the actual value of the DataAspectRatio property.
daspect
ans = 1×3

     4     8     1
This means that four units in length along the x-axis cover the same data values as eight units in length along the y-axis and one unit in length along the z-axis. The axes fill the plot box, which has an aspect ratio of [1 1 1] by default.
If you want to view the surface plot so that the relative magnitudes along each axis are equal with respect to each other, you can set the DataAspectRatio to [1 1 1].
daspect([1 1 1])
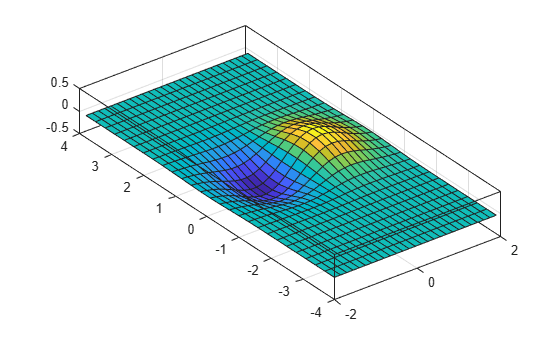
Setting the value of the DataAspectRatio property also sets the DataAspectRatioMode to manual and overrides stretch-to-fill so the specified aspect ratio is achieved.
Plot Box Aspect Ratio
Looking at the value of the PlotBoxAspectRatio for the graph in the previous section shows that it has now taken on the former value of the DataAspectRatio. The pbaspect function to returns the value of the PlotBoxAspectRatio:
pbaspect
ans = 1×3

     4     8     1
Notice that MATLAB rescaled the plot box to accommodate the graph using the specified DataAspectRatio.
The PlotBoxAspectRatio property controls the shape of the axes plot box. By default, MATLAB sets this property to [1 1 1] and adjusts the DataAspectRatio property so that graphs fill the plot box or until reaching a constraint.
When you set the value of the DataAspectRatio, and thereby prevent it from changing, MATLAB varies the PlotBoxAspectRatio instead.
If you specify both the DataAspectRatio and the PlotBoxAspectRatio, MATLAB is forced to change the axis limits to obey the two constraints you have already defined.
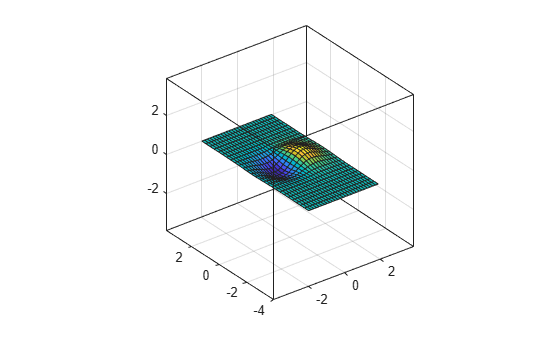
Continuing with the mesh example, if you set both properties, MATLAB changes the axis limits to satisfy the two constraints placed on the axes.
daspect([1 1 1])
pbaspect([1 1 1])
Adjusting Axis Limits
The axes also has properties for setting the x-, y-, and z-axis limits. However, specifying the axis limits with the PlotBoxAspectRatio and DataAspectRatio properties overconstrains the axes. For example, this command specifies axis limits that conflict with the PlotBoxAspectRatio value.
set(gca,'DataAspectRatio',[1 1 1],...
        'PlotBoxAspectRatio',[1 1 1],...
        'XLim',[-4 4],...
        'YLim',[-4 4],...
        'ZLim',[-1 1])

If you query the plot box aspect ratio, you can see that the PlotBoxAspectRatio value changed to accommodate the axis limits.
pbaspect
ans = 1×3

     4     4     1
Displaying Real Objects
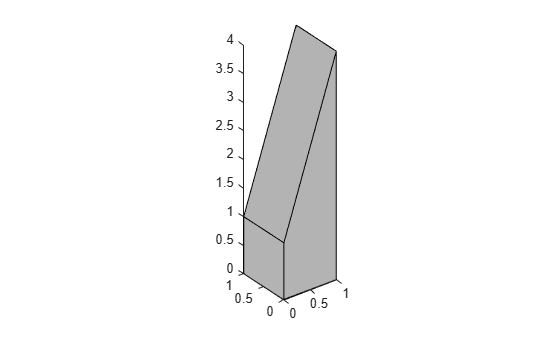
If you want to display an object so that it looks realistic, you need to change MATLAB defaults. For example, this data defines a wedge-shaped patch object.
vert = [0 0 0; 0 1 0; 1 1 0; 1 0 0; 0 0 1; 0 1 1; 1 1 4; 1 0 4];
fac = [1 2 3 4; 2 6 7 3; 4 3 7 8; 1 5 8 4; 1 2 6 5; 5 6 7 8];
patch('Vertices',vert,'Faces',fac,...
   'FaceColor',[0.7 0.7 0.7],'EdgeColor','k')
view(3)
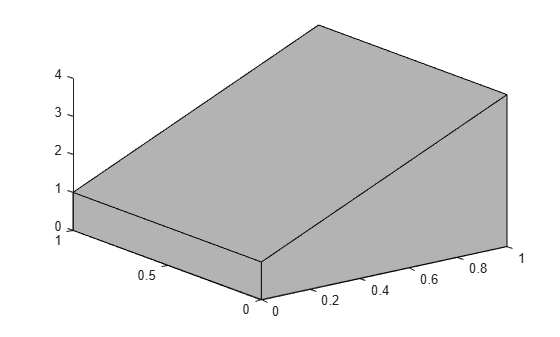
However, this axes distorts the actual shape of the solid object defined by the data. To display it in correct proportions, set the DataAspectRatio. Setting this property makes the units equal in the x-, y-, and z-directions and prevents the axes from being stretched to fill the position rectangle, revealing the true shape of the object.
set(gca,'DataAspectRatio',[1 1 1])