Développer des classes de diagrammes
Définissez votre propre classe de diagrammes en créant une sous-classe de la classe de base ChartContainer. Si vous écrivez des scripts ou des fonctions pour créer des visualisations spécialisées et que vous les partagez avec d’autres personnes, vous pouvez envisager de créer une implémentation de classe. La création d’une classe vous permet de proposer une interface pratique à vos utilisateurs. S’ils souhaitent personnaliser certains aspects de votre diagramme, ils pourront définir des propriétés au lieu d’être obligés de modifier et réexécuter votre code graphique. Vous concevez votre propre ensemble personnalisé de propriétés et contrôlez celles qui seront accessibles à vos utilisateurs. Ces derniers pourront les modifier en lignes de commande ou les examiner dans le Property Inspector. Les instances de votre classe sont membres de la hiérarchie des objets graphiques. En conséquence, vos diagrammes sont compatibles avec de nombreux aspects du système graphique. Pour plus d’informations, consultez Chart Development Overview.
Classes
matlab.graphics.chartcontainer.ChartContainer | Base class for developing chart objects |
matlab.graphics.chartcontainer.mixin.Legend | Add legend support to chart container subclass |
matlab.graphics.chartcontainer.mixin.Colorbar | Add colorbar support to chart container subclass |
Méthodes
Rubriques
Fondamentaux du développement de diagrammes
- Chart Development Overview
Learn the basic steps for authoring a class of chart objects. - Develop Charts With Polar Axes, Geographic Axes, or Multiple Axes
Define a class that contains one or more Cartesian, polar, or geographic axes. - Write Constructors for Chart Classes
Customize the calling syntax for creating a chart object.
Gérer les propriétés et les méthodes
- Managing Properties of Chart Classes
Validate property values, optimize how properties update, and customize how properties display for the charts you author. - Enabling Convenience Functions for Setting Axes Properties
Enable thetitle,xlim, andylimfunctions for a class of chart objects. - Saving and Loading Instances of Chart Classes
Develop chart that preserves interactive changes when you save it. - Optimized Chart Class for Displaying Variable Number of Lines
Define a class that displays a variable number of lines with optimized code that reuses existing line objects. - Chart Class with Custom Property Display
Develop a chart object that displays two lines and has a custom property display.
Informations connexes
Sélection d՚exemples

Chart Class for Displaying Variable Size Tiling of Plots
Define a class for displaying a tiling of plots that varies according to the size of the user's data.
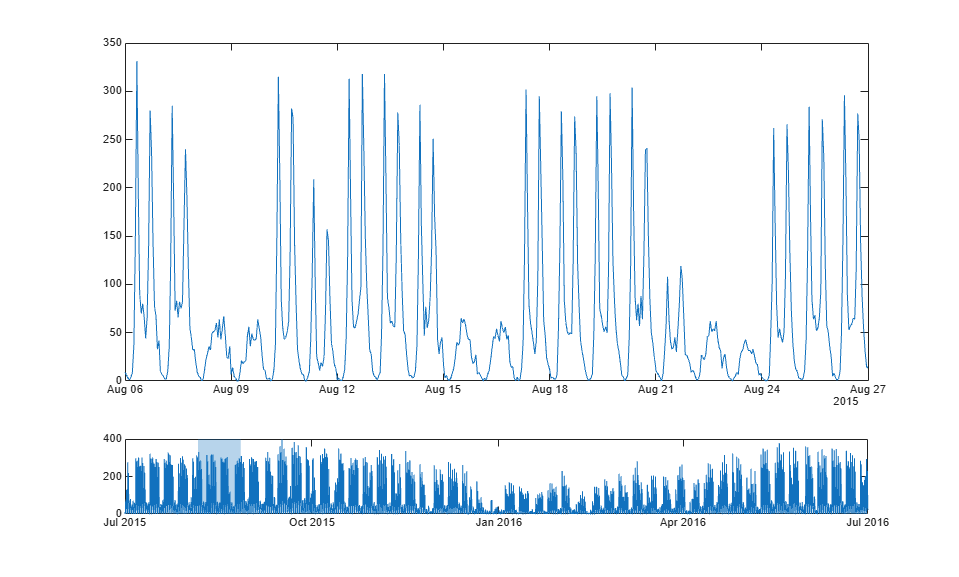
Chart Class Containing Two Interactive Plots
Define a chart class that accepts a timetable and displays two interactive line plots in the same figure.
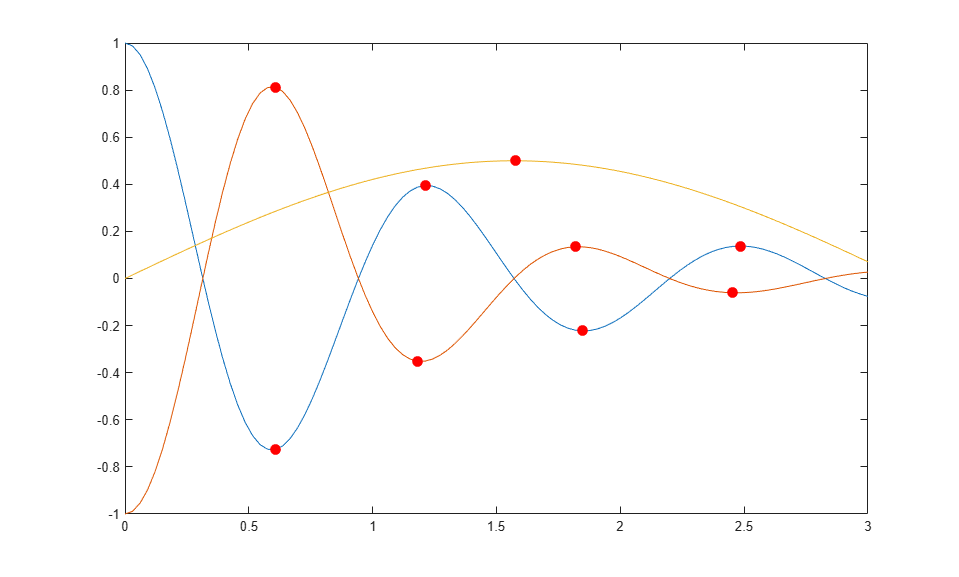
Chart Class with Variable Number of Lines
Define a class that displays a variable number of lines depending on the size of the array specified by the user.