Compute Phase Noise Measurements Using Spectrum Analyzer
Measure the phase noise of a signal and plot it against the specified target phase noise profile using the phase noise measurement settings in the Spectrum Analyzer block toolstrip. The Phase Noise axis in the scope display shows the phase noise of the signal. The Phase Noise panel at the bottom shows the corresponding measurements.
To enable the phase noise measurements, click the Phase Noise button in the Measurements tab of the spectrum analyzer toolstrip. When you click the Phase Noise drop-down arrow, you can view and modify the phase noise measurement settings such as the frequency offsets, target phase noise profile, and even label the phase noise measurements.
Phase Noise Properties
Phase Noise
Click the Phase Noise button to enable the phase noise measurements. A Phase Noise axis and the Phase Noise panel appear in the scope window when you click this button.
This property is tunable.
Programmatic Use
See Enabled.
Frequency Offsets (Hz)
Specify the frequency offsets in Hz at which the scope measures the phase noise as a numeric vector with monotonically increasing values.
This property is tunable.
Default: [10
100
1000]
Programmatic Use
See FrequencyOffset.
Plot Target Phase Noise
Select this property to plot the target phase noise profile. You can specify this profile in the Target Phase Noise (dBc/Hz) parameter.
This property is tunable.
Default: Off
Programmatic Use
See PlotTargetPhaseNoise.
Target Phase Noise (dBc/Hz)
Specify the target phase noise profile in dBc/Hz as a numeric vector of the same length as the Frequency Offsets (Hz) vector.
To enable this property, select the Plot Target Phase Noise property.
This property is tunable.
Default: [-300
-300
-300]
Programmatic Use
See TargetPhaseNoise.
Label Phase Noise
Select this property to label the measured phase noise on the plot. When you select
this parameter, the spectrum analyzer labels the measured phase noise values on the plot
as SN1, SN2, and so on.
This property is tunable.
Default: Off
Programmatic Use
See LabelPhaseNoise.
Measure Phase Noise of Sinusoidal Signal Using Spectrum Analyzer Block
Measure the phase noise of a noisy sinusoidal signal using the Phase Noise measurement settings of the Spectrum Analyzer block.
Open the filterNoisySignal model. The input is a noisy sinsuoidal signal with two tones, one at 1 kHz and the other at 15 kHz. The noise is a white Gaussian noise signal with a mean of 0 and a variance of 0.05. The signal contains 256 samples per frame and has a sample rate of 44100 Hz. Filter this signal using the Lowpass FIR Filter block. The passband edge frequency of the filter is 8 kHz and the stopband edge frequency is 10 kHz.
Visualize the input signal and the filtered signal using the Spectrum Analyzer block.
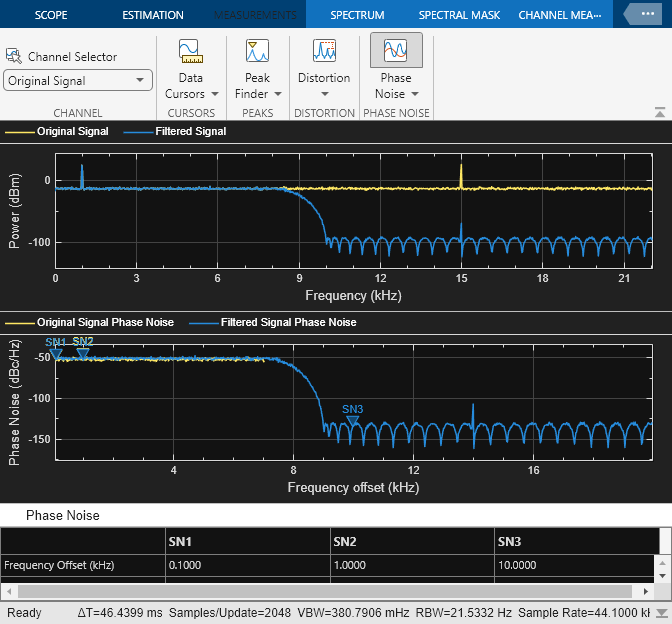
Enable the Phase Noise measurements in the spectral display by clicking the Phase Noise button in the Measurements tab of the spectrum analyzer toolstrip. Set the frequency offsets to [100 1000 10000] and label the phase noise measurement values.
Run the model. The Phase Noise axis of the spectrum analyzer display shows the phase noise of the original signal and the filtered signal. The Phase Noise panel at the bottom of the display shows the corresponding phase noise measurements.
open_system("filterNoisySignal")
sim("filterNoisySignal.slx")