compare
Compare test data to historical data ensemble for similarity models
Description
compare(___,
specifies plotting options using one or more name-value pair arguments.Name,Value)
Examples
Load training data.
load('pairwiseTrainTables.mat')The training data is a cell array of tables. Each table is a degradation feature profile for a component.
Create and train a pairwise similarity model.
mdl = pairwiseSimilarityModel;
fit(mdl,pairwiseTrainTables,"Time","Condition")
Load testing data.
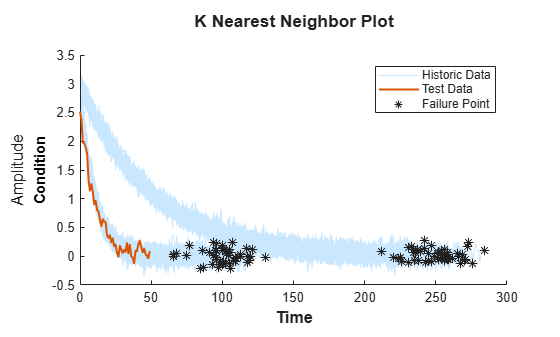
load('pairwiseTestData.mat')Compare the degradation profile of the test data to the profiles of the historical data ensemble.
compare(mdl,pairwiseTestData)
Load training data.
load('pairwiseTrainTables.mat')The training data is a cell array of tables. Each table is a degradation feature profile for a component.
Create and train a pairwise similarity model.
mdl = pairwiseSimilarityModel;
fit(mdl,pairwiseTrainTables,"Time","Condition")
Load testing data.
load('pairwiseTestData.mat')Compare the degradation profile of the test data to the profiles of the 10 most similar members of the historical data ensemble.
compare(mdl,pairwiseTestData,'NumNearestNeighbors',10)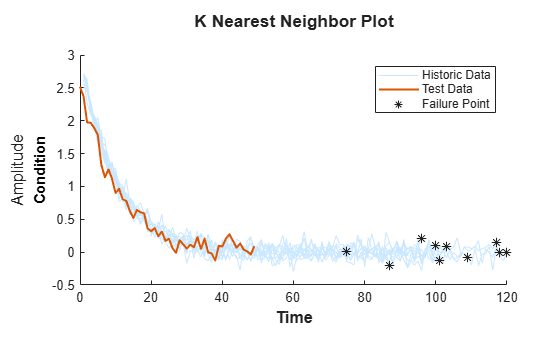
Input Arguments
Name-Value Arguments
Version History
Introduced in R2018a