getTFMap
Description
Examples
Generate a signal that consists of a voltage-controlled oscillator and four Gaussian atoms. The signal is sampled at 14 kHz for 2 seconds. Plot the spectrogram of the signal.
Fs = 14000; t = (0:1/Fs:2)'; gaussFun = @(A,x,mu,f) exp(-(x-mu).^2/(2*0.01^2)).*sin(2*pi*f.*x)*A'; atoms = gaussFun([1 1 1 1]/10,t,[0.2 0.5 1 1.75],1e3*[2 6 2 5]); vcoIn = vco(chirp(t+.1,0,t(end),3).*exp(-2*(t-1).^2),[0.1 0.4]*Fs,Fs); vcoOut = vcoIn + 0.1*atoms;
Create a set of spectrogram options for time-frequency labeling. Control the spectrogram resolution by leakage. Specify a leakage and an overlap of 99%.
beta = 0.2; opts = labelSpectrogramOptions("leakage", ... Leakage=40*(1-beta),Overlap=99);
Get the STFT map to be used in time-frequency labeling.
[s,w,n] = getTFMap(opts,vcoOut);
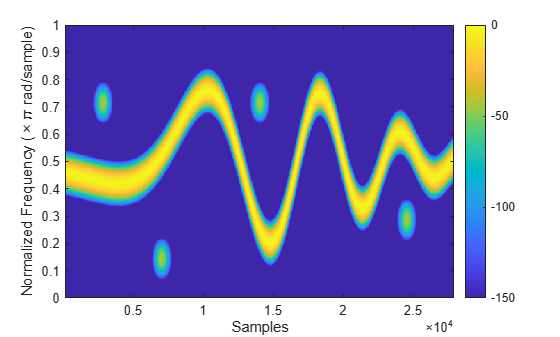
Plot the STFT along normalized frequencies and samples.
function tfImage(s,f,t,xlbl,ylbl) imagesc(t,f,s) axis xy xlabel(xlbl) ylabel(ylbl) colorbar clim([-150 0]) end wn = w/pi; tfImage(s,wn,n,"Samples","Normalized Frequency (\times\pi rad/sample)")

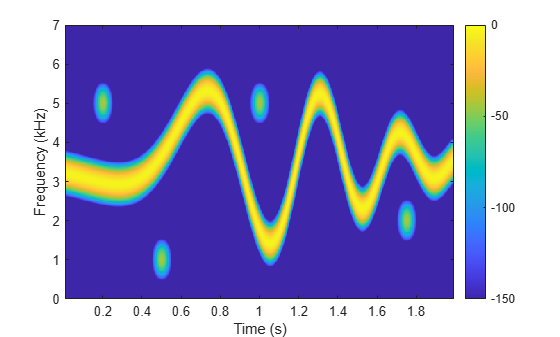
Get the STFT map to be used in time-frequency labeling. Plot the STFT along cyclical frequencies and midpoint-segment times.
[s,f,t] = getTFMap(opts,vcoOut,Fs); fn = f/1e3; tfImage(s,fn,t,"Time (s)","Frequency (kHz)")

Input Arguments
Spectrogram options, specified as a labelSpectrogramOptions object.
Example: opts =
labelSpectrogramOptions("windowlength",Window="chebyshev") specifies a
labelSpectrogramOptions object that stores spectrogram options for
time-frequency labeling.
Input signal, specified as a vector or MATLAB® timetable with uniformly sampled times and one variable comprising a column vector.
Example: x = chirp(0:1e-3:1,0,0.5,100,"quadratic") specifies a
quadratic swept-frequency signal.
Example: x =
timetable(seconds(0:1e-3:1)',chirp(0:1e-3:1,0,0.5,100,"quadratic")')
specifies a timetable containing a quadratic swept-frequency signal.
Data Types: single | double
Complex Number Support: Yes
Sample rate, specified as a positive scalar.
If you specify
Fs, thengetTFMapassumes that the input signalxhas a sample rate ofFsHz.If you do not specify
Fsor set it to empty[], thengetTFMapuses a normalized sample rate.
Do not specify Fs if you specify
x as a timetable. The getTFMap function
infers the sample rate from the time values specified in x.
Output Arguments
Size of STFT of input signal, returned as a matrix. Time increases across the
columns of s and frequency increases down the rows.
Frequencies associated with STFT output, returned as a vector.
If you specify
Fs, thenfcontains cyclical frequencies in Hz.If you do not specify
Fs, thenfcontains normalized frequencies in radians/sample.
The frequencies that the getTFMap function
returns in f depends on the resolution type of the spectrogram
(), on whether
opts.ResolutionTypex is real-valued or complex-valued, and on whether you specify
the sample rate, Fs.
| x | Frequency Range for
| |
|---|---|---|---|
|
| ||
"leakage" | Real-valued | [0,π] rad/sample | [0,Fs/2] Hz |
| Complex-valued | [–π,π] rad/sample | [–Fs/2,Fs/2] Hz | |
"rbw" or
"windowlength" | Real-valued | [0,π] rad/sample | [0,Fs/2] Hz |
| Complex-valued | (–π,π] rad/sample | (–Fs/2,Fs/2] Hz | |
Times associated with STFT output, returned as a vector.
If you specify
Fs, thentcontains time instants in seconds.If you do not specify
Fs, thentcontains sample indices in sample numbers.
The values in t correspond to the midpoint of each
segment.
Version History
Introduced in R2026a
MATLAB Command
You clicked a link that corresponds to this MATLAB command:
Run the command by entering it in the MATLAB Command Window. Web browsers do not support MATLAB commands.
Sélectionner un site web
Choisissez un site web pour accéder au contenu traduit dans votre langue (lorsqu'il est disponible) et voir les événements et les offres locales. D’après votre position, nous vous recommandons de sélectionner la région suivante : .
Vous pouvez également sélectionner un site web dans la liste suivante :
Comment optimiser les performances du site
Pour optimiser les performances du site, sélectionnez la région Chine (en chinois ou en anglais). Les sites de MathWorks pour les autres pays ne sont pas optimisés pour les visites provenant de votre région.
Amériques
- América Latina (Español)
- Canada (English)
- United States (English)
Europe
- Belgium (English)
- Denmark (English)
- Deutschland (Deutsch)
- España (Español)
- Finland (English)
- France (Français)
- Ireland (English)
- Italia (Italiano)
- Luxembourg (English)
- Netherlands (English)
- Norway (English)
- Österreich (Deutsch)
- Portugal (English)
- Sweden (English)
- Switzerland
- United Kingdom (English)