simulateMagnitudeAndPhase
R2026bSimulate circuit in frequency domain and obtain magnitude and phase data
Since R2026b
Syntax
Description
Examples
This example shows how to simulate two different electrochemical
impedance spectroscopy (EIS) models in the frequency domain and plot the magnitude and
phase of the impedances by using the simulateMagnitudeAndPhase
function.
Create a fractional-order equivalent circuit model with a resistor in series with a parallel configuration of a second resistor and a capacitor.
eisfom = eisModel("R0+(R1,C1)")eisfom =
EISModel with properties:
CircuitTopology: "R0+(R1,C1)"
NumParameters: 3
ParameterList: ["R0" "R1" "C1"]
ParameterValues: [0.0250 0.0035 150]
CircuitImpedance: "(R0 + ((R1 * (1/(i*w*C1))) / (R1 + (1/(i*w*C1)))))"
ParameterList: ["R0" "R1" "C1"]Define the frequency points you want to simulate the model at.
freq = logspace(-2,5,100)
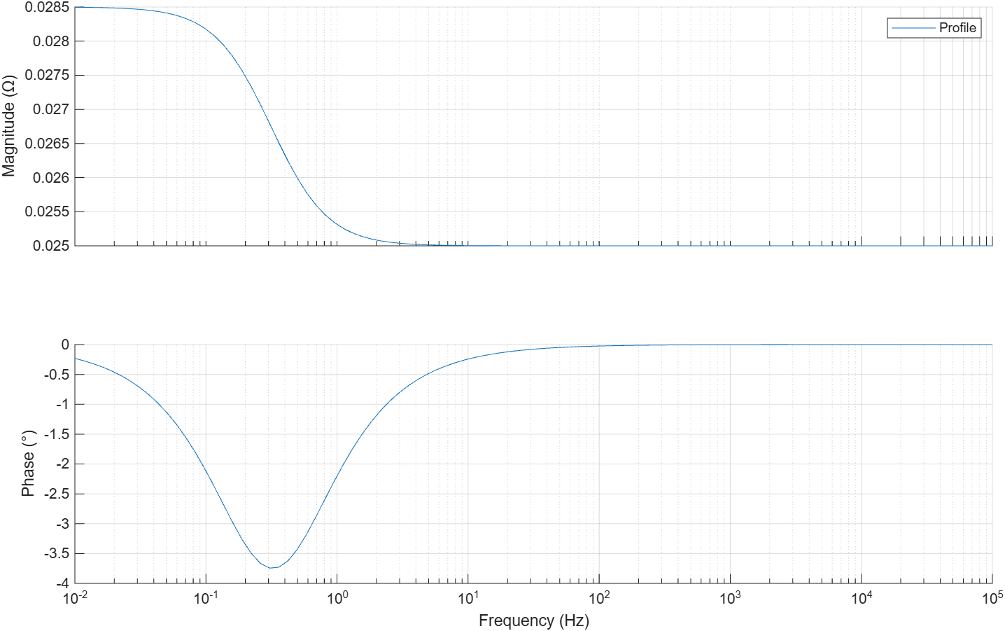
Simulate the EIS circuit at these frequencies and plot the magnitude and phase of the impedance.
[magnitude,phase,frequency,handle] = simulateMagnitudeAndPhase(eisfom,freq,Plot="on");
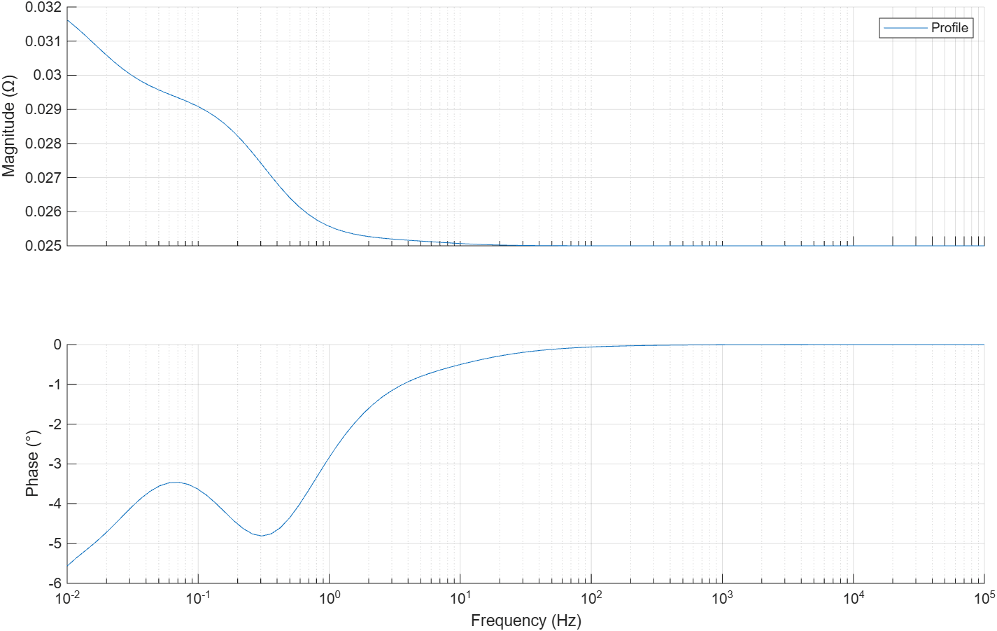
Now add a Warburg impedance term to the EIS circuit topology and observe how the magnitude and phase change.
eisfom.CircuitTopology = "R0 + (R1,C1) + SIW1";eisfom =
EISModel with properties:
CircuitTopology: "R0 + (R1,C1) + SIW1"
NumParameters: 4
ParameterList: ["R0" "R1" "C1" "SIW1"]
ParameterValues: [0.0250 0.0035 150 1.0000e-03]
CircuitImpedance: "((R0 + ((R1 * (1/(i*w*C1))) / (R1 + (1/(i*w*C1))))) + (SIW1*(w)^(-1/2) - SIW1*i*(w)^(-1/2)))"
ParameterList: ["R0" "R1" "C1" "SIW1"]Simulate the circuit and plot the magnitude and phase. Starting in R2026b, you can
plot the magnitude and phase directly by using the Plot name-value
argument of the simulateMagnitudeAndPhase function.
[simRealZ,simImagZ,handle] = simulateMagnitudeAndPhase(eisfom,freq,Plot="on");
Input Arguments
Output Arguments
Version History
Introduced in R2026b

