Diagnostic Viewer
View, compare, and diagnose errors and warnings generated by Simulink models
Description
Use the Diagnostic Viewer to view and analyze the diagnostic messages generated by a Simulink® model. A model generates these diagnostic messages during various run-time operations, such as model load, simulation, build, or update diagram. The Diagnostic Viewer displays the diagnostic messages as errors, warnings, and information. When you modify the model and simulate it again, new diagnostic messages can be added or removed. You can identify these differences in the diagnostic messages using the Comparator in the Diagnostic Viewer and analyze how different conditions or parameters affect the model.
The Diagnostic Viewer enables you to:
View diagnostic messages.
Filter, search, save, copy, or group diagnostic messages.
Fix errors and warnings by using suggested actions.
Identify the sources of errors in a model.
Suppress or restore diagnostic messages.
Provide feedback to improve diagnostic messages.
Compare diagnostic messages from different run-time operations.
Save diagnostic messages from a specific operation to use as a baseline for comparisons with diagnostic messages from future operations.
Viewer Toolbar
Manage diagnostic messages using the Viewer available in the Diagnostic Viewer toolbar.
| Action | |
|---|---|
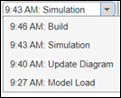
| The time and stages appear in a drop-down list. To view the diagnostic messages specific to a stage, select a stage from the drop-down list. |
| Click to save the diagnostic details from a specific stage as a baseline file in JSON format. |
| Click to open the Filter by pane to filter diagnostics based on model components. Click again to close the pane. |
| Click to hide all error messages. Click again to view. |
| Click to hide all warning messages. Click again to view. |
| Click to hide all information messages. Click again to view. |
| Enter keywords to search specific messages. |
| Save, copy, or clear all the diagnostic messages using
the To save or copy the messages for a selected stage, right-click anywhere inside the Diagnostic Viewer. |
| Group warnings with the same message ID. |


Comparator Toolbar
Compare diagnostic messages from different run-time operations of a model using the Comparator available in the Diagnostic Viewer toolbar.
| Action | |
|---|---|
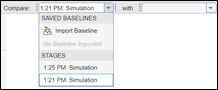
| Select two stages to compare from the drop-down menus. If you have previously saved baseline files, you can import them to use for comparison. |
| Count of the diagnostic messages that are added and removed. Select to view the details of the added error and warning messages. |
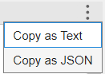
| Copy the comparison report to the clipboard in text or JSON format. |

Diagnostic Message Pane
View the diagnostic messages in the diagnostic message pane of the Diagnostic Viewer. The diagnostic message pane displays the error, warning, and information messages for a selected stage. Each stage represents a run-time operation, such as model load, simulation, build, or diagram update. As more operations occur, new stages are created. For cases involving multiple operations, child stages are created to form a hierarchical structure.
These diagnostic messages are color-coded for quick identification:
 — Errors
 — Warnings
 — Errors encountered during model load. Any
subsequent operations, such as model update without addressing these high priority
warning messages, are marked as errors.
— Errors encountered during model load. Any
subsequent operations, such as model update without addressing these high priority
warning messages, are marked as errors. — Information
When you point to a diagnostic message, you get the options to copy a diagnostic message
or provide feedback. To copy a diagnostic message, click the copy icon
![]() . To provide feedback, click the add comment icon
. To provide feedback, click the add comment icon
![]() and enter your suggestions to improve the diagnostic
message in the text box. The character limit of the feedback is 1024 characters.
and enter your suggestions to improve the diagnostic
message in the text box. The character limit of the feedback is 1024 characters.
Note
Use the feedback box to provide suggestions on diagnostic messages. To request help or report technical bugs, contact Technical Support at Contact Support.
Suggested Actions
You may fix the errors and warnings generated during a run-time operation using the suggested actions. For errors and warnings that have a predefined fix, Diagnostic Viewer displays Suggested Actions.
A diagnostic message can have multiple fixes and suggestions.
Fix — Use a suggested fix to automatically rectify the error. Each fix is associated with a Fix button. In some cases, you can also provide values before applying the fix.
Once a fix is successfully applied, the Fix button for the diagnostic message is no longer available. If a fix was unsuccessful, the Diagnostic Viewer displays a failure message.
Suggestion — Use the suggestions for the errors and warnings that cannot be automatically fixed.

Open the Diagnostic Viewer
In the Simulink toolstrip, select Debug > Diagnostics, and then select Diagnostic Viewer.
You can use the Diagnostic Viewer in two ways:
Standalone — Displays diagnostic messages of all the models in a separate window with one tab for each model.
Docked with model window — Displays the diagnostic messages specific to a model.
To dock the Diagnostic Viewer to a model, in the Debug tab of the toolstrip, select Diagnostics, and then select Docked Diagnostic Viewer. Alternatively, in the Modeling tab of the toolstrip, select Environment > Simulink Settings. In the Simulink Settings dialog box, select Editor > Use docked Diagnostic Viewer.
Note
Setting the Diagnostic Viewer as docked with model or standalone is a system-wide operation. The setting applies to all models.
Examples
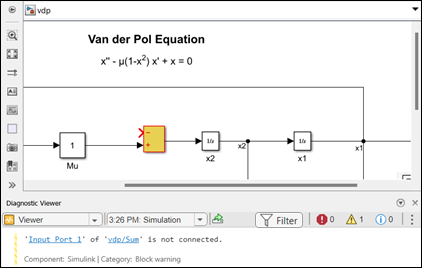
You can use the Diagnostic Viewer to identify the sources of errors within a model.
When you simulate a model with an unconnected block, the Diagnostic Viewer displays a warning message. Click the hyperlink for the unconnected block in the warning message. The corresponding block in the model is highlighted for easy identification.
Use the Diagnostic Viewer to display the errors and warnings when you
build a model using custom compilers. To achieve this, create a
ToolchainInfo object for the selected compiler, and define
compiler-specific patterns to identify and display the diagnostic messages on the
Diagnostic Viewer.
To display diagnostic messages for a model using the MinGW64® compiler on a Linux® platform, use these steps.
Create a ToolchainInfo object tool. For more
information, see Register Custom Toolchain and Build Executable (Simulink Coder).
Specify compiler-specific error and warning patterns.
tool.setDirective('ErrorPattern','error:');
tool.setDirective('WarningPattern','warning #(\d+):');
Specify compiler-specific filename and line number patterns.
tool.setDirective('FileNamePattern','[^\s]*\w+\.(c|h)');
tool.setDirective('LineNumberPattern','\(\d+\)');
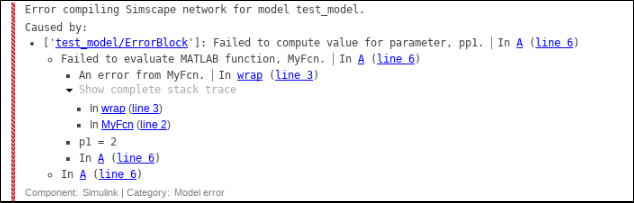
The Diagnostic Viewer can trace the source of an error so that you
can investigate the errors in your model easily. If the error is in a file that is being
called from another file, the diagnostic message shows as an expandable stack. You can
expand or collapse the stack, as required. Expanding the stack displays information about
the file and the line in which the error or warning is located. You can click any of the
links to go to the error or warning. You can also see the same diagnostic message with
stack trace enabled while using the sim command in MATLAB®.
Note
You cannot trace the exact source of an error or warning in a protected file.
Diagnostic Viewer allows you to suppress diagnostic messages for
specific numerical errors and warnings, such as overflow, saturation, and precision loss
for particular objects, and for errors where the diagnostic level is set to
error in the Diagnostics section of the
Model Configuration Parameters. When you suppress a diagnostic message, you can also add a
justification for suppressing the message.
To suppress a diagnostic message, click Suppress. Any suppressions you apply to the diagnostic messages are saved with the model.

To add comments to the suppressed diagnostic message, click Add Justification. To restore the suppressed diagnostic, select Restore.

To view the suppressed diagnostic messages of a model, open the Suppression Manager. On the Debug tab, select Diagnostics > Suppression Manager.
The Suppression Manager displays the diagnostic messages, suppression locations, and comments for a model in a tabular format. When you select a diagnostic message, you get the option to restore, add a comment, or move the diagnostic message to the parent level from the block level. Enter keywords in the Filter box to search the diagnostic messages, suppression locations, and comments. You can also select multiple diagnostic messages and leave a global comment.

Alternatively, you can suppress the diagnostic messages programmatically as described in Suppress Diagnostic Messages Programmatically.
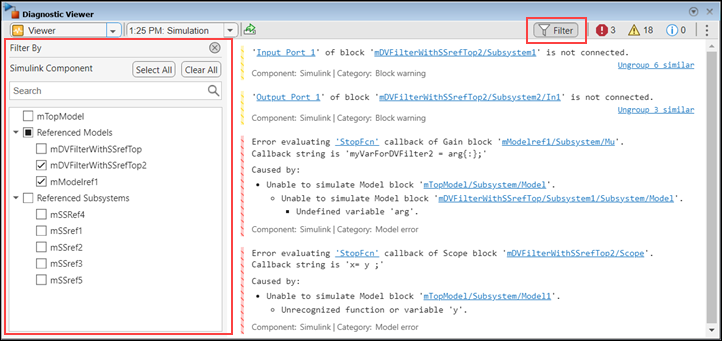
When you simulate a model that has referenced models and referenced subsystems, the Diagnostic Viewer provides filters to select specific model components and view their diagnostics. By using these filters, you can determine whether diagnostics originate from the main model or its referenced files and focus on diagnostics for selected components only.
When you simulate a model, the Viewer displays all the generated diagnostic messages for that stage. To filter the diagnostics, open the Filter By pane by clicking Filter in the Viewer available in the Diagnostic Viewer.
In the Filter By pane, select the model name or any of its referenced models and referenced subsystems to view diagnostic messages that are generated from those selected components only. The Filter By pane retains any selections you apply for that diagnostic stage until you close the Diagnostic Viewer. Additionally, searching for diagnostic messages, grouping or ungrouping similar warnings, or applying error, warning, or information filters, apply only to the filtered diagnostics.
Note
Only the referenced models and referenced subsystems that are present in the diagnostic details are listed in the Filter by pane.