Model Multitask Execution and Real-Time Code Execution Profiling on Android Device
This example shows how to use multirate multitasking along with real-time code execution profiling for a Simulink® model that uses blocks from the Simulink Support Package for Android® Devices.
The support package now supports:
Treating each discrete rate in a Simulink model as a separate task in model code generation
Concurrent execution of tasks on your Android device
Detect task overruns
Print error or debug logs
Multirate multitasking-base preemption
Prerequisites
For more information on how to use the Simulink Support Package for Android Devices to run a Simulink model on an Android device, refer to the Getting Started with Android Devices example.
Required Hardware
Android device such as phone or tablet
Micro USB cable
Simulink Model
This example uses a preconfigured Simulink model from the Simulink Support Package for Android Devices. All the tasks in this example use this Simulink model.
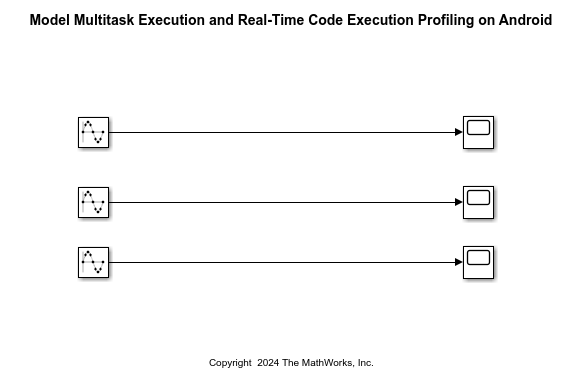
Open the androidGettingStartedProfiling Simulink model.

You can perform the same tasks as described in this example on any Simulink model that is configured for Simulink Support Package for Android Devices.
Enable Embedded Coder Features
Enable Embedded Coder features for Simulink models deployed to Android devices.
Open the androidGettingStartedProfiling Simulink model.
In the Configuration Parameters dialog box, in the left navigation pane, select Hardware Implementation and you can select either
Android DeviceorAndroid Device (64bit).Below the Hardware board settings section, click Advanced parameters.
Select Use Embedded Coder Features (Embedded Coder).
Run External Mode in Background Thread
This task shows how to configure external mode to run in a background thread. When external mode runs in the model thread, external mode executes after each execution step of the model and collects data at the base rate of the model. When model code consumes most of the thread execution time in each time step, external mode execution overruns into the next time step. This overrun delays the start of the next model execution step and degrades the real-time behavior of the deployed model. For more information, see Run external mode in a background thread.
Open the androidGettingStartedProfiling Simulink model.
In the Configuration Parameters dialog box, in the left navigation pane, select Hardware Implementation.
In the Hardware board settings > Target hardware resources > External mode, select Run external mode in a background thread.
Run Simulink Model in External Mode
On the Hardware tab of the Simulink model, in the Run on Hardware section, set the Stop Time to 10 seconds and click Monitor & Tune.
Detect Task Overruns
This task shows how to configure the androidGettingStartedProfiling Simulink model to detect and notify you when a task overrun occurs. A task overrun occurs if your Android device still performs one instance of a task when the next instance of that task is scheduled to begin.
Open the androidGettingStartedProfiling Simulink model.
In the Configuration Parameters dialog box, in the left navigation pane, select Hardware Implementation.
In the Hardware board settings > Operating System/scheduler section, select Detect task overruns.
Run Simulink Model in External Mode
On the Hardware tab of the Simulink model, in the Run on Hardware section, set the Stop Time to 10 seconds and click Monitor & Tune. A toast message appears on the application running on your Android device whenever Simulink detects a task overrun.

For a detailed description on a task overrun, execute this command on Android Studio Logcat to view the log data.
package:com.example.androidGettingStartedProfiling

You can also copy the log file from Android Studio Logcat to the host computer. Execute this Android Debug Bridge (adb) command in the MATLAB® Command Window to get a copy of the log files in .txt format on your host computer. Ensure that the Android device is connected to the computer and the ADB is properly set up.
adb logcat -d -s com.example.androidGettingStartedProfiling > logcat.txt
In this command, logcat.txt is the name of the log file on your host computer. Replace com.example.test with the package name you want to filter the logs for.
The Simulink Support Package for Android Devices also provides an API to execute the adb command to copy the log file from Logcat to your host computer.
[result, success]=codertarget.android.internal.runAdb(Android SDK Path, 'logcat -d com.example.test > logcat.txt')
To obtain the path for your Android SDK, execute these command on MATLAB Command Window.
t = codertarget.android.AppBuilder(1)
ans =
t =
AppBuilder with properties:
         GradleVersion: '7.5'
              JavaPath: 'C:\Users\AppData\Local\Android\Studio\jbr'
               NDKPath: 'C:\Users\AppData\Local\Android\Studio\sdk\ndk\25.1.8937393'
            OpenCVPath: 'C:\ProgramData\MATLAB\SupportPackages\R2022a\3P.instrset\androidopencv.instrset\opencv-android-sdk'
               SDKPath: 'C:\Users\AppData\Local\Android\Studio\sdk'
     ArmComputeLibPath: [2x1 struct]
               AppName: []
           ApkFilePath: []
           PackageName: []
           ProjectPath: []
          ActivityName: []
             DefDevice: []
               Devices: []
          NDKBuildType: 'release'
       SkipDeviceCheck: 1
  AndroidPluginVersion: '7.4.0'
     AppCompactVersion: []
         DesignVersion: []
     CompileSdkVersion: '33'
     BuildToolsversion: '33.0.1'
               defOpts: [1x1 struct]
       IOServerVersion: 1
      TargetDeviceType: 'ARM Compatible->ARM Cortex'
t.SDKPath
ans =
'C:\Users\AppData\Local\Android\Studio\sdk'
While the androidGettingStartedProfiling application runs on your Android device, execute this command on the host terminal to observe the live log data for any task overruns.
adb.exe logcat reportOverrun:E MW-SL-ANDROID:D *:S

Configure Code Execution Profiling for Simulink Model
This task shows how to configure the androidGettingStartedProfiling Simulink model for profiling the execution of different functions in your model. Function execution profiling gives more insight into the behavior of generated code by profiling each function and overall tasks for each sample rate.
1. Open the androidGettingStartedProfiling Simulink model.
2. In the Configuration Parameters dialog box, in the left navigation pane, go to Code Generation > Verification.
3. In the Code execution time profiling, select Measure task execution time (Embedded Coder).
4. For function execution times, from the Measure function execution times (Embedded Coder) drop-down list, select one of these options.
Coarse (referenced models and subsystems only)- if you want to analyze generated function code for the main model components.Detailed (all function call sites)- if you want to analyze generated function code for all blocks in the model.
5. In the Workspace variable field, specify a name. When you run the simulation, the software generates a variable with this name in the MATLAB base workspace. The variable contains the execution-time measurements.
6. From the Save options (Embedded Coder) drop-down list, select one of these options.
Summary data only- Stream execution times to the Simulation Data Inspector during the simulation. Store minimal information at the end of the simulation. Use this option if you want to generate only a report and reduce memory usage, for example, in a long simulation.All data- Stream execution times to the Simulation Data Inspector during the simulation. Store execution-time profiles in the base workspace and generate a report. After the simulation, you can use methods from thecoder.profile.ExecutionTimeandcoder.profile.ExecutionTimeSectionclasses to retrieve execution-time measurements for every call to each profiled section of code that occurs during the simulation. If you select this option, the metrics display window and generated report display the Simulation Data Inspector icon. When you click the icon, the software imports simulation results into the Simulation Data Inspector. You can then plot execution times and manage and compare plots from various simulations.Metrics only- Reduces bandwidth usage for the communication channel between Simulink® and the Android application. During the simulation, the software does not stream execution times to the Simulation Data Inspector. On your Android device, the software stores maximum execution times, average execution times, and number of calls. At the end of the simulation, Simulink uploads the data from the Android device to your development computer.
Run Simulink Model in External Mode
On the Hardware tab of the Simulink model, in the Run on Hardware section, set the Stop Time to 10 seconds and click Monitor & Tune. Simulink writes the execution profiling data in the ModelName.txt file in the application data cache location. For example, for the androidGettingStartedProfiling Simulink model, you can locate the file in the /storage/emulated/0/Android/data/com.example.androidGettingStartedProfiling/files/androidGettingStartedProfiling.txt path. Execute this command to transfer the file to the host computer. This command copies the text file as mentioned in the current working directory and saves the data in the output variable. In this example, the output variable is executionProfile.
executionProfile = codertarget.profile.getData(androidGettingStartedProfiling);
You can also visualize the data by executing this command.
coder.profile.show(executionProfile);
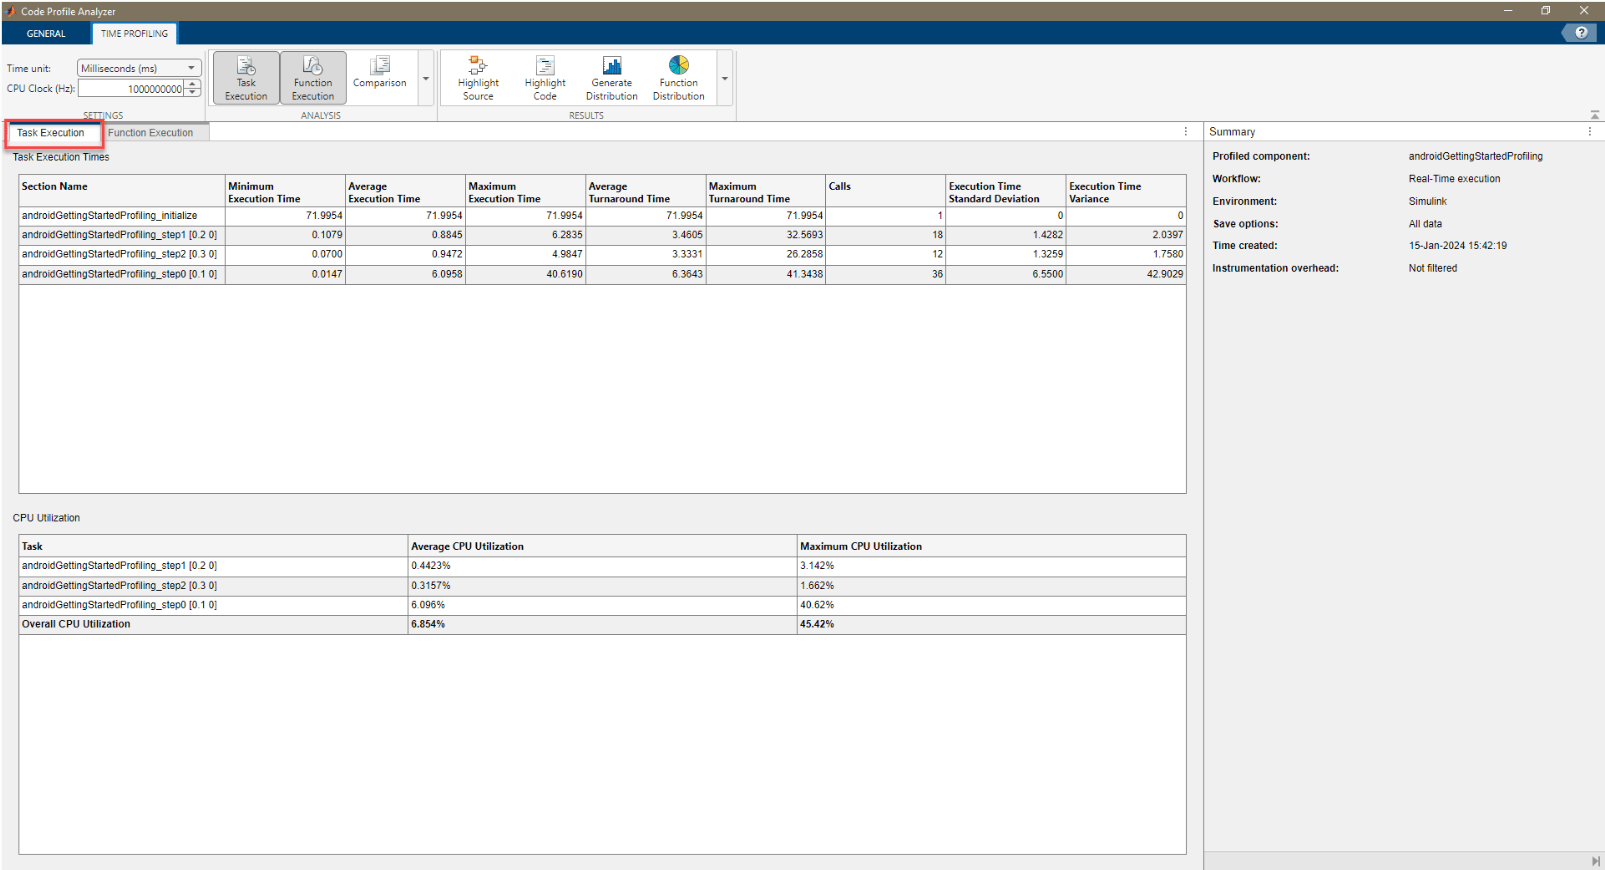
Observe and analyze the task execution times in the Task Execution tab of the Code Profile Analyzer.

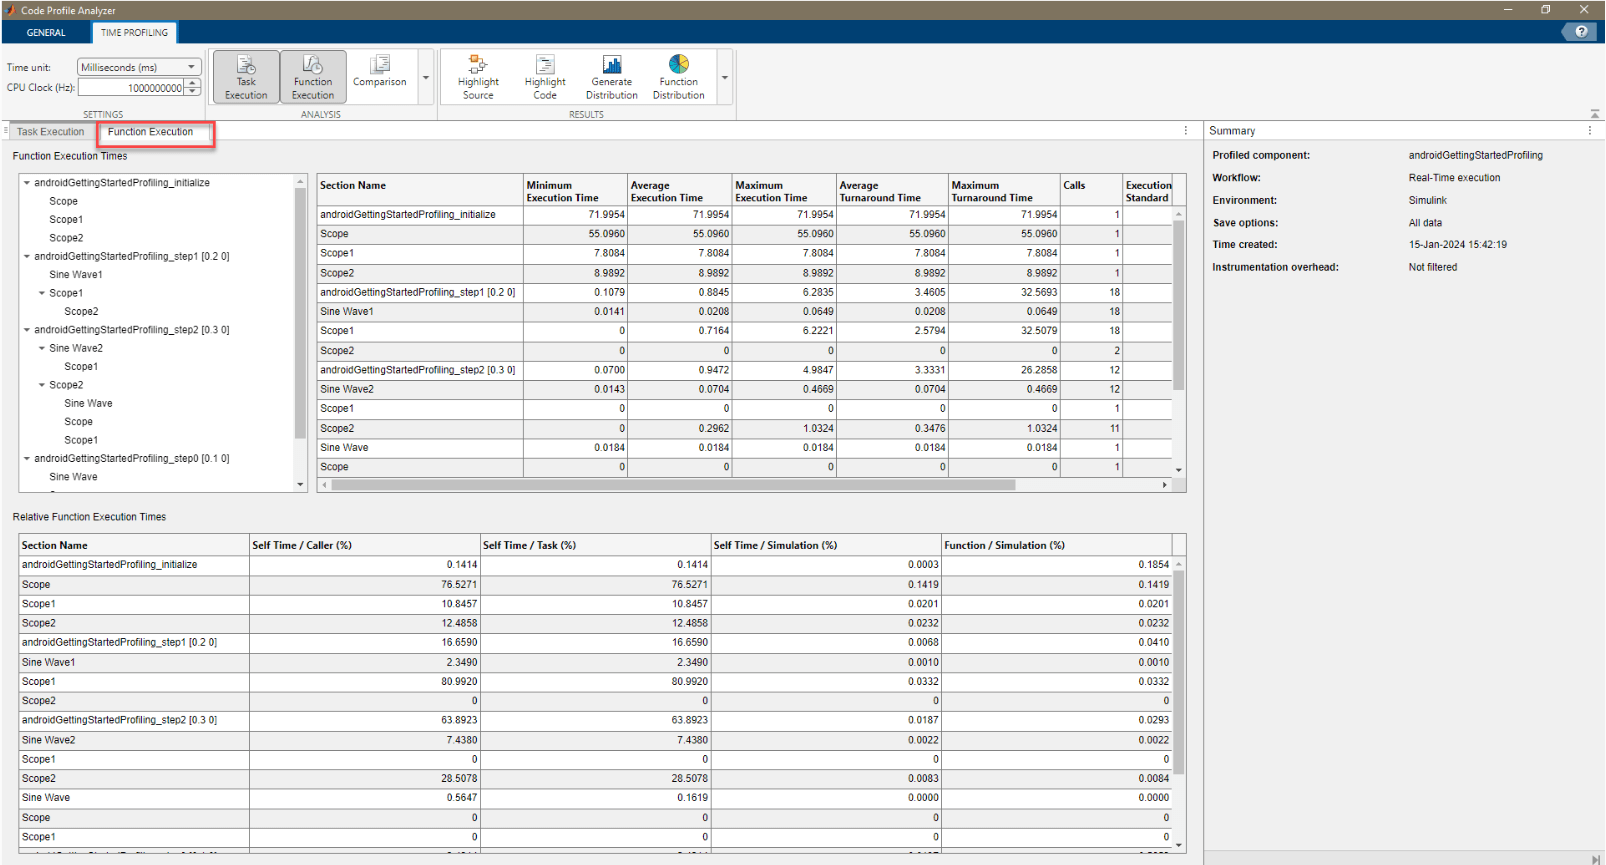
Similarly, Observe and analyze the function execution times in the Function Execution tab of the Code Profile Analyzer.

Debug Errors in Simulink Model
This task shows how to debug any errors in an Android Simulink model.
Open the androidGettingStartedProfiling Simulink model.
In the Configuration Parameters dialog box, in the left pane, go to Code Generation. In the Build process section, set Build configuration to
Debug. For more information, see Build configuration (Simulink Coder).
Run Simulink Model in External Mode
On the Hardware tab of the Simulink model, in the Run on Hardware section and click Monitor & Tune. Observe the debug log data in Android Studio Logcat.