Model Coverage Display for Stateflow Charts
Simulink® Coverage™ displays model coverage results for individual blocks directly in Stateflow® charts. When you simulate your model with coverage enabled, the model displays:
Highlighting for Stateflow elements that receive model coverage during simulation
A context-sensitive display of summary model coverage information for each object
For details on enabling coverage highlighting, see Enable Coverage Highlighting.
Display Model Coverage with Model Coloring
When you enable coverage and simulate the model with the Run button, the model highlights individual Stateflow elements receiving coverage. If you run your model using sim the model does not display coverage results by default. In this case, you can see the model highlighting by using cvmodelview.
To access the model, in the MATLAB® Command Window, enter
openExample("sf_car").In the Modeling tab, click Model Settings.
In the Coverage pane of the Configuration Parameters dialog box, select Enable coverage analysis.
In the Coverage metrics section, set Structural coverage level to
Modified Condition Decision Coverage (MCDC).Click OK.
Simulate the model by clicking the Run (Coverage) button.
Open the shift_logic Stateflow chart.
After simulation ends, the model highlights the chart objects that were analyzed for coverage.
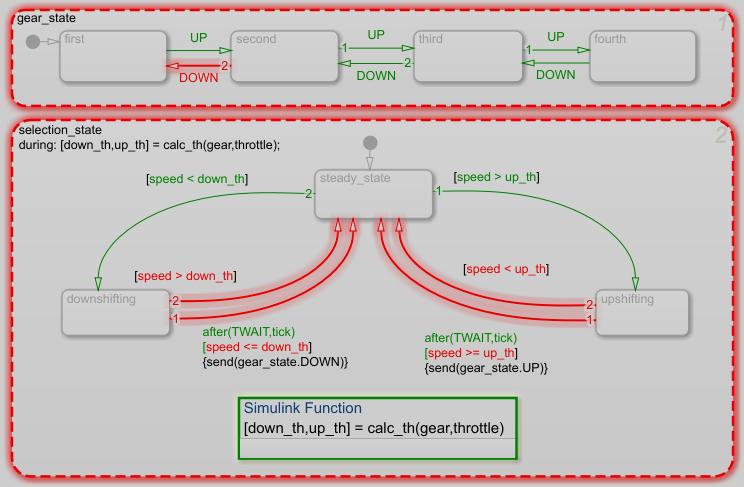
The colors indicate the completeness of coverage analysis:
Green border for full coverage
Red border for partial or missing coverage
Light grey for elements not analyzed for coverage
States that include executable code and conditional transitions display granular text coloring based on which outcomes are satisfied. Green indicates satisfied outcomes and red indicates unsatisfied outcomes. For example, consider the following chart:
![The chart is named State 1. The entry condition is [if (a > 0) && (b > 0)]. The condition b>0 is colored red and the rest of the expression is colored green. The state itself is outlined red.](stateflowhighlight2.png)
In this example, the if statement has evaluated to both true and false and therefore has full decision coverage. Within the statement, condition a > 0 evaluated to both true and false and has full condition coverage. Condition b > 0, however, evaluated to true but not false and therefore has only partial condition coverage.
Granular text coloring appears for charts and transitions using both C and MATLAB as the action language.