Validate Estimation Results
This topic shows how to validate estimation results in the Parameter Estimator app. After you estimate parameters as described in Estimate Parameters and States, validate the estimation results by simulating the model using the estimated values and comparing the results to another measured data set.
Configure and Perform Validation
To validate a model using the Parameter Estimator:
Load a validation data set.
At the MATLAB® prompt, load the validation data into the MATLAB workspace.
Add a new experiment for validation.
In the Parameter Estimator, in the Validation tab, click New Experiment. A new experiment with default name appears in the Experiments area of the app. To rename the experiment
ValidationData, right-click the experiment and select Rename from the drop-down menu.
Import the validation data set into the validation experiment.
Right click the experiment name, and select Edit. For example, specify
[time,iodataval(:,1)]in Inputs , and[time,iodataval(:,2)]in Outputs.Specify the experiment for validation.
When you create an experiment, it is by default selected for estimation. To select another experiment for validation, in the Validation tab, click Select Experiments.
In the Select Experiments dialog box, clear Estimation and select Validation for the validation experiment.

Specify the estimation results to use in the validation.
After you import validation data, select the estimated parameter values to validate.
The estimation results are saved in the
EstimatedParamsvariable in the Results area of the app. In the Validation tab, click Select Results to Validate.To validate the estimated parameters, in the Select Results dialog box, select
EstimatedParamsand clearUse current parameter values.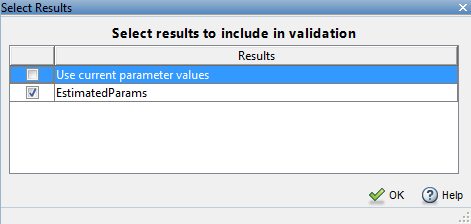
Select the plots to display at the end of validation.
Parameter Estimator can display the measured and simulated responses and the residuals plot at the end of validation. Select the plots to display by checking the corresponding box on the Validation Tab.

Validate the estimation results.
On the Validation tab, click Validate. The Validation Progress Report shows the status of the validation.

Compare Measured and Simulated Responses
Compare measured validation data against the model output simulated with the estimated parameters.
The app displays the experiment plot for each experiment selected for validation. Each experiment plot shows the measured data, and data from simulation using each set of results selected. For example, the following figure shows the experiment plot for the
ValidationExpdata.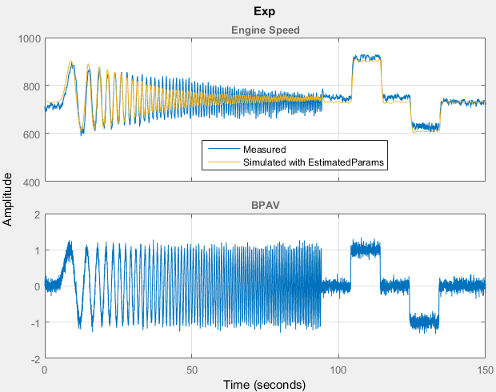
Examine the Residuals Plot.
The residuals plot shows the difference between simulated response and measured data. When there is a good fit between the simulated output and measured data, the residuals show the following behavior:
Lie within a small percent of the maximum output variation.
Do not display any systematic patterns.
For example, you can see from the following figure that the residuals for
ValidationExpdata satisfy both criteria.