Create, Store, and Open MATLAB Figures
You can create figures using MATLAB® commands to include with test results and reports. Enter the commands in a test case section that accepts MATLAB code. These sections include the test case Custom Criteria section, and callbacks that can execute with your test case.
If you include code that creates figures with your test case, you can:
Display the figures after the test runs
Store the figures with your test case
Include them in a report
Access stored figures from your test results
To specify this behavior, use the Test File Options section under the Test File settings.
Select Close all open figures at the end of execution if you do not need to see the figures right after the test executes, for example, if you are storing the figures or including them in a report. Clear this check box if you are not storing the figures and you want to view them after the test executes.
Select Store MATLAB figures if you want to save the figures with the test results. This option also enables you to open the figures from the results and to include them in a report.
After you run the test, the figures appear under MATLAB Figures in the test case results.
Create a Custom Figure for a Test Case
In this example, add code that creates a figure to the Custom Criteria section of a test case. To access the figure from the test results, set options on the test file.
Open the model to test using
openExample('sldemo_absbrake').In the Test Manager, create a test file and name it
custom_figures.In the default test case, under System Under Test, set the model to
sldemo_absbrake.Under Custom Criteria, select the function customCriteria(test) check box and paste this code in the text box.
h = findobj(0,'Name','ABS Speeds and Slip');
if isempty(h)
    h=figure('Position',[26   100   452   700],...
        'Name','ABS Speeds and Slip',...
        'NumberTitle','off');
end
figure(h)
set(h,'DefaultAxesFontSize',8)

% Log data object and store in sldemo_absbrake_output variable
out = test.sltest_simout.get('sldemo_absbrake_output');

% Plot wheel speed and car speed
subplot(3,1,1);
plot(out.get('yout').Values.Vs.Time, ...
    out.get('yout').Values.Vs.Data);
grid on;
title('Vehicle speed'); ylabel('Speed(rad/sec)'); xlabel('Time(sec)');
subplot(3,1,2);
plot(out.get('yout').Values.Ww.Time, ...
    out.get('yout').Values.Ww.Data);
grid on;
title('Wheel speed'); ylabel('Speed(rad/sec)'); xlabel('Time(sec)');
subplot(3,1,3);
plot(out.get('slp').Values.Time, ...
    out.get('slp').Values.Data);
grid on;
title('Slip'); xlabel('Time(sec)'); ylabel('Normalized Relative Slip');
Set the figure options for the test file
custom_figures. Under Test File Options:Select Close all open figures at the end of execution. This option closes figures created by your Test Manager MATLAB code.
Select Store MATLAB figures.
With the test case or the test file selected, click Run.
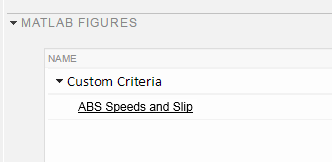
In the Results and Artifacts pane, select the test case under the results for this test run. Click the links under MATLAB Figures to see the plots generated when the test ran. The plot generated by the code you entered appears under Custom Criteria.
Include Figures in a Report
You can select the MATLAB Figures option in the Create Test Results Report dialog box to include custom figures in your report. Alternatively, you can set report options under Test File Options. The Test File Options settings are saved with the test file.
Select the test file
custom_figures.Under Test File Options, select Generate report after execution. The section expands, displaying the same report options you can set using the dialog box.
To see the figures regardless of how the tests performed, set Results for to
All Tests.Select the MATLAB figures check box.
With the test file selected, run the test. Running the test generates the report and opens it in the PDF viewer.
Examine the report. The plot generated by the code you entered under Custom Criteria appears in the report section Custom Criteria Plots.
See Also
sltest.testmanager.Options | getOptions (TestSuite) | getOptions (TestCase) | getOptions (TestFile)