Perform a Power-Loss Analysis
This example shows how to analyze power loss and how to mitigate transient power dissipation behavior. Analyzing power loss, with and without transients, is useful for determining if components are operating within safety and efficiency guidelines.
Prerequisite
This example requires a simulation log variable in your MATLAB® workspace. The model in this example is configured to log Simscape™ data for the whole model for the entire simulation time.
To learn how to determine if a model is configured to log simulation data, see Examine the Simulation Data Logging Configuration of a Model.
Calculate Average Power Losses for the Simulation
Open the model. At the MATLAB command prompt, enter
openExample("simscapeelectrical/PowerLossAnalysisExample");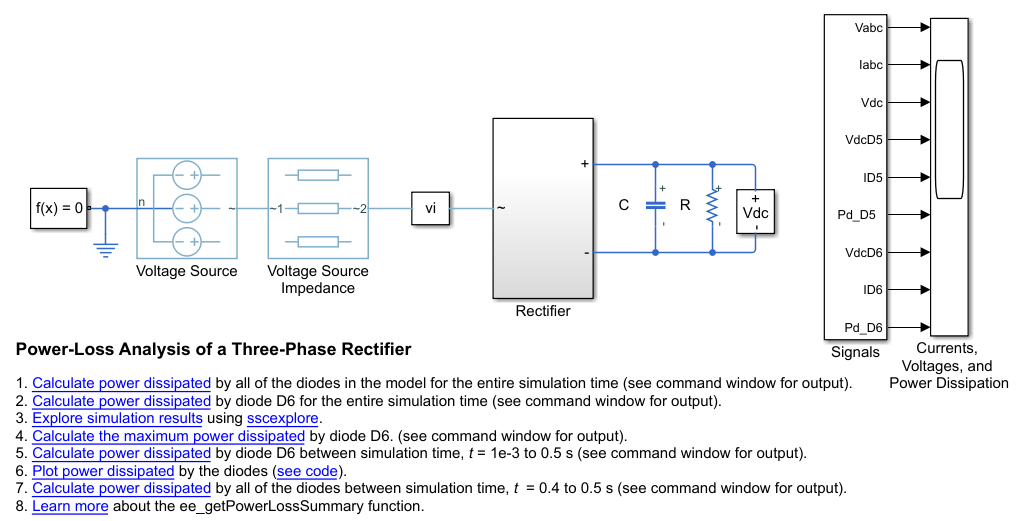
Simulate the model.
sim("PowerLossAnalysis")The simulation log variable, which is named
simlog_PowerLossAnalysis, appears in the workspace.Calculate the average losses for the entire simulation for each of the diodes in the model.
rectifierLosses = ee_getPowerLossSummary(simlog_PowerLossAnalysis.Rectifier)
rectifierLosses =
  6×2 table

      LoggingNode       Power
    ________________    _____

    {'Rectifier.D6'}    11514
    {'Rectifier.D3'}    11514
    {'Rectifier.D2'}    11511
    {'Rectifier.D5'}    11511
    {'Rectifier.D1'}    11511
    {'Rectifier.D4'}    11511
On average, diodes D3 and D6 dissipate more power than the other diodes in the rectifier.
Analyze Power Dissipation Differences Using Instantaneous Power Dissipation
The Diode blocks each have a power_dissipated variable, which measures instantaneous power dissipation. To investigate the differences in the average power dissipated by the diodes, view the simulation data using the Simscape Results Explorer.
Open the simulation data using the Results Explorer.
sscexplore(simlog_PowerLossAnalysis)
View the instantaneous power dissipated by the diodes.
Expand the Rectifier node
Expand the D1 through D6 nodes
Click the
power_dissipatednodes for diode D1, and then Ctrl+click thepower_dissipatednodes for the other five diodes.In the Results Explorer window, in the Plot Options section, click the Layout button and set it to
Separate.
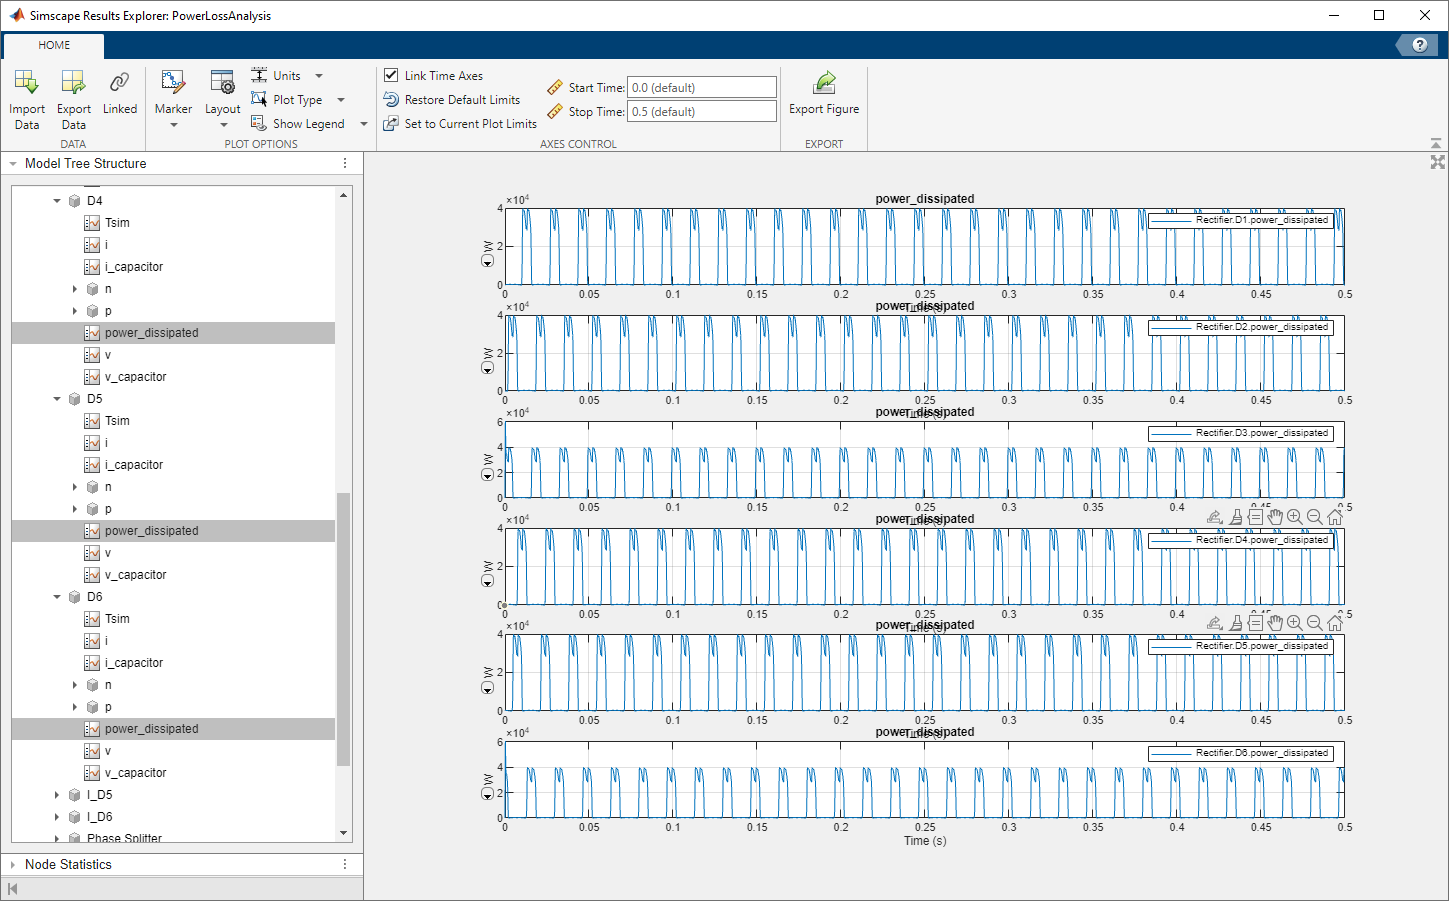
At the beginning of the simulation, there is a difference in the power dissipation for each diode.
Take a closer look at the differences. Overlay the plots and zoom to the beginning of the simulation. In the Results Explorer window:
For Stop time, specify
0.02.Set Layout to
Overlay.
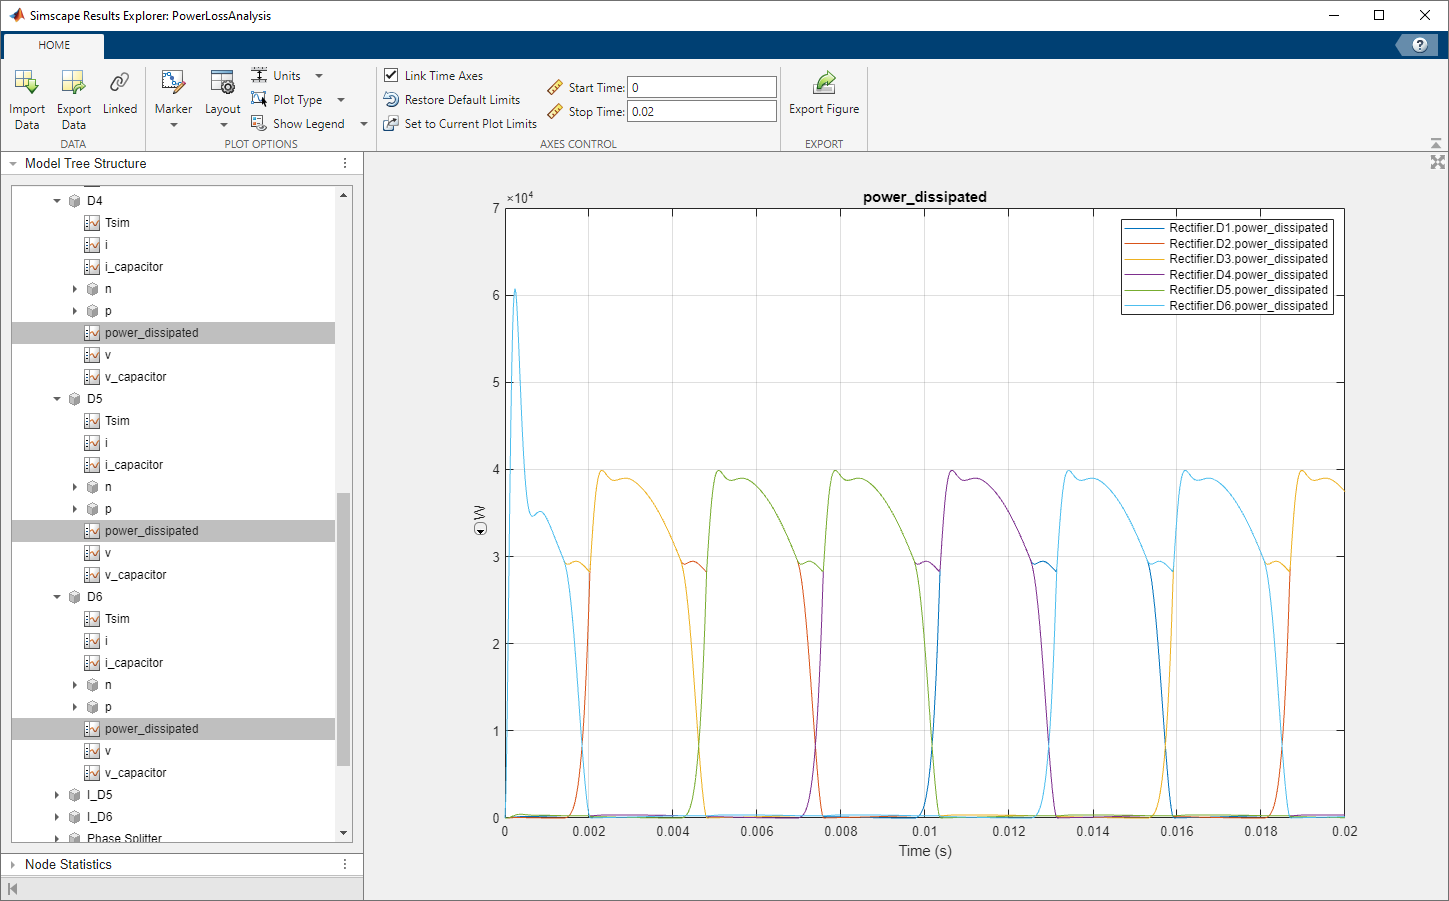
The variation in power dissipation is due to transient behavior at the beginning of the simulation. The model reaches steady state at simulation time, t ⋍ 0.001 seconds.
Determine the average power dissipation for only the diodes during the interval that contains transient behavior.
rectifierLosses = ee_getPowerLossSummary(simlog_PowerLossAnalysis.Rectifier,0,1e-3)
rectifierLosses =

  6×2 table

      LoggingNode       Power
    ________________    ______

    {'Rectifier.D3'}     38772
    {'Rectifier.D6'}     38772
    {'Rectifier.D4'}    293.62
    {'Rectifier.D5'}    293.62
    {'Rectifier.D1'}    139.11
    {'Rectifier.D2'}     31.26
The average power dissipated by diodes D3 and D6 exceeds the average for the other diodes.
Output a table of the maximum power dissipation for each diode, for the entire simulation time.
pd_D1_max = max(simlog_PowerLossAnalysis.Rectifier.D1.power_dissipated.series.values);
pd_D2_max = max(simlog_PowerLossAnalysis.Rectifier.D2.power_dissipated.series.values);
pd_D3_max = max(simlog_PowerLossAnalysis.Rectifier.D3.power_dissipated.series.values);
pd_D4_max = max(simlog_PowerLossAnalysis.Rectifier.D4.power_dissipated.series.values);
pd_D5_max = max(simlog_PowerLossAnalysis.Rectifier.D5.power_dissipated.series.values);
pd_D6_max = max(simlog_PowerLossAnalysis.Rectifier.D6.power_dissipated.series.values);

diodes = {'D1';'D2';'D3';'D4';'D5';'D6'};
PowerMax = [pd_D1_max;pd_D2_max;pd_D3_max;pd_D4_max;pd_D5_max;pd_D6_max];

T = table(PowerMax,'RowNames', diodes)
T = 6×1 table PowerMax ________ D1 39892 D2 39892 D3 60746 D4 39891 D5 39892 D6 60746The maximum instantaneous power dissipation for diodes D3 and D6 is almost double the maximum instantaneous power dissipation for the other diodes.
Mitigate Transient Effects in Simulation Data
To mitigate the transient power dissipation at the beginning of the simulation, use the final simulation state to initialize a new simulation at steady-state conditions.
Configure the model to save the final state.
Open the model configuration parameters.
In the Solver pane, change the Stop time from
0.5to 1e-3.In the Data Import/Export pane, select these options:
Final States
Save final operating point
Click Apply.
Run the simulation.
The final state is saved as the variable xFinal in the MATLAB workspace.
Configure the model to initialize using xFinal, in the model configuration parameters.
In the Data Import/Export pane:
Select the Initial state option.
Change the Initial state parameter value from
xInitialtoxFinal.Clear the Final states option.
In the Solver pane, change the Stop time to
0.5.Click OK.
Run the simulation.
View the data from the new simulation.
Click the Import Data button in the Simscape Results Explorer.
Click OK to confirm that
simlog_PowerLossAnalysisis the variable name that contains the logged data.To see the data more clearly, click and drag the legend away from the peak amplitudes.
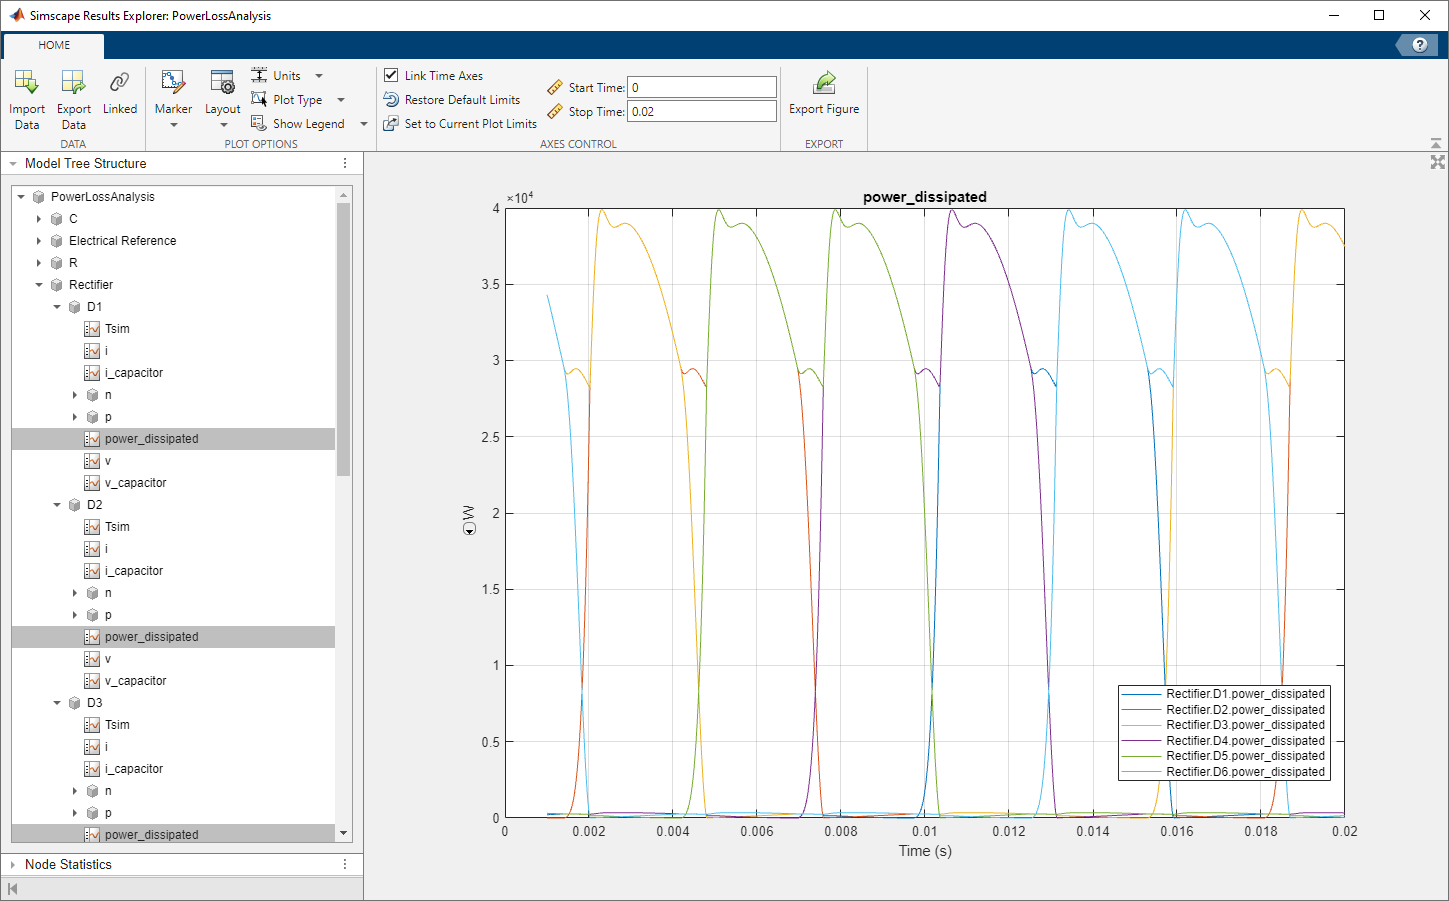
The plot shows that the simulation no longer contains the transient.
Output a table of the maximum power dissipation for each diode, for the modified simulation.
pd_D1_max = max(simlog_PowerLossAnalysis.Rectifier.D1.power_dissipated.series.values);
pd_D2_max = max(simlog_PowerLossAnalysis.Rectifier.D2.power_dissipated.series.values);
pd_D3_max = max(simlog_PowerLossAnalysis.Rectifier.D3.power_dissipated.series.values);
pd_D4_max = max(simlog_PowerLossAnalysis.Rectifier.D4.power_dissipated.series.values);
pd_D5_max = max(simlog_PowerLossAnalysis.Rectifier.D5.power_dissipated.series.values);
pd_D6_max = max(simlog_PowerLossAnalysis.Rectifier.D6.power_dissipated.series.values);

diodes = {'D1';'D2';'D3';'D4';'D5';'D6'};
PowerMax = [pd_D1_max;pd_D2_max;pd_D3_max;pd_D4_max;pd_D5_max;pd_D6_max];

T = table(PowerMax,'RowNames', diodes)
T = 6×1 table PowerMax ________ D1 39892 D2 39892 D3 39891 D4 39891 D5 39892 D6 39892The maximum instantaneous power dissipation for diodes D3 and D6 is the same as the maximum instantaneous power dissipation for the other diodes.