La traduction de cette page n'est pas à jour. Cliquez ici pour voir la dernière version en anglais.
convertToChart
Convertissez une table de transition d’état en diagramme Stateflow
Depuis R2023b
Description
Exemples
Cet exemple indique comment convertir une table de transition d’état en un diagramme Stateflow®.
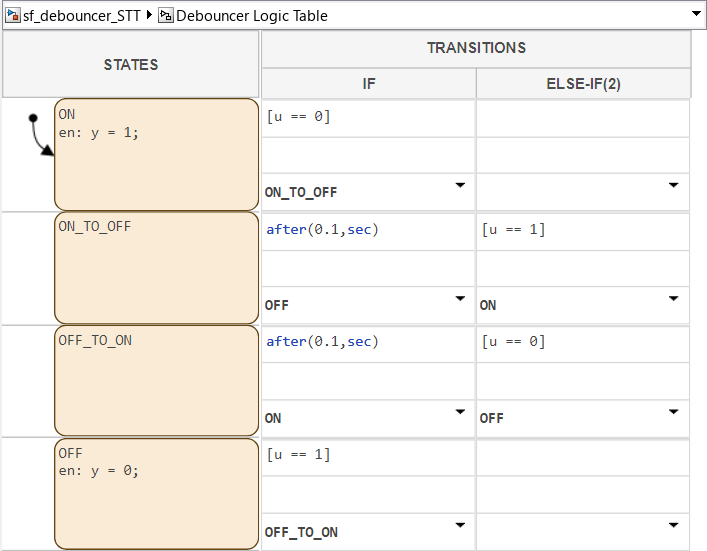
Ouvrez le modèle fourni à titre d’exemple et accédez à l’objet Stateflow.StateTransitionTableChart.
open_system("sf_debouncer_STT")
table = find(sfroot,"-isa","Stateflow.StateTransitionTableChart");
view(table)
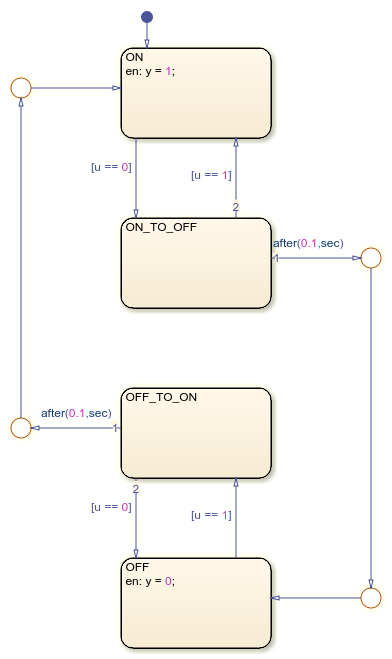
Convertissez la table de transition d’état en un diagramme Stateflow.
chart = convertToChart(table);
view(chart)
Arguments d'entrée
Historique des versions
Introduit dans R2023b