RegressionEnsemble
Ensemble regression
Description
RegressionEnsemble
combines a set of trained
weak learner models and data on which these learners were trained. It can predict
ensemble response for new data by aggregating predictions from its weak
learners.
Creation
Create a regression ensemble object using fitrensemble
.
Properties
Ensemble Properties
This property is read-only.
Method used to combine weak learner weights, returned as either
'WeightedAverage'
or 'WeightedSum'
.
Data Types: char
This property is read-only.
Fit information, returned as a numeric array. The
FitInfoDescription
property describes the content of this
array.
Data Types: double
This property is read-only.
Description of the information in FitInfo
, returned as a character
vector or cell array of character vectors.
Data Types: char
| cell
This property is read-only.
Names of weak learners in the ensemble, returned as a cell array of character vectors.
The name of each learner appears just once. For example, if you have an ensemble of 100
trees, LearnerNames
is {'Tree'}
.
Data Types: cell
This property is read-only.
Method used by fitrensemble
to create the ensemble,
returned as a character vector.
Data Types: char
This property is read-only.
Parameters used in training the ensemble, returned as an
EnsembleParams
object. The properties of
ModelParameters
include the type of ensemble, either
'classification'
or 'regression'
, the
Method
used to create the ensemble, and other parameters,
depending on the ensemble.
This property is read-only.
Number of trained weak learners in the ensemble, returned as a positive integer.
Data Types: double
This property is read-only.
Reason the fitrensemble
function stopped adding weak
learners to the ensemble, returned as a character vector.
Data Types: char
This property is read-only.
Result of using the regularize
object function on the ensemble,
returned as a structure. Use Regularization
with shrink
to lower the resubstitution error and shrink the ensemble.
Data Types: struct
This property is read-only.
Trained weak learners, returned as a cell vector. The entries of the cell vector contain the corresponding compact regression models.
Data Types: cell
This property is read-only.
Trained weak learner weights, returned as a numeric vector. TrainedWeights
has NumTrained
elements, where
NumTrained
is the number of weak
learners in the ensemble. The ensemble computes the predicted
response by aggregating weighted predictions from its
learners.
Data Types: double
Predictor Properties
This property is read-only.
Bin edges for numeric predictors, specified as a cell array of p numeric vectors, where p is the number of predictors. Each vector includes the bin edges for a numeric predictor. The element in the cell array for a categorical predictor is empty because the software does not bin categorical predictors.
The software bins numeric predictors only if you specify the NumBins
name-value argument as a positive integer scalar when training a model with tree learners.
The BinEdges
property is empty if the NumBins
value
is empty (default).
You can reproduce the binned predictor data Xbinned
by using the
BinEdges
property of the trained model
mdl
.
X = mdl.X; % Predictor data
Xbinned = zeros(size(X));
edges = mdl.BinEdges;
% Find indices of binned predictors.
idxNumeric = find(~cellfun(@isempty,edges));
if iscolumn(idxNumeric)
idxNumeric = idxNumeric';
end
for j = idxNumeric
x = X(:,j);
% Convert x to array if x is a table.
if istable(x)
x = table2array(x);
end
% Group x into bins by using the discretize
function.
xbinned = discretize(x,[-inf; edges{j}; inf]);
Xbinned(:,j) = xbinned;
end
Xbinned
contains the bin indices, ranging from 1
to the number of bins, for the numeric predictors. Xbinned
values are 0
for categorical predictors. If X
contains NaN
s, then
the corresponding Xbinned
values are NaN
s.Data Types: cell
This property is read-only.
Categorical predictor
indices, specified as a vector of positive integers. CategoricalPredictors
contains index values indicating that the corresponding predictors are categorical. The index
values are between 1 and p
, where p
is the number of
predictors used to train the model. If none of the predictors are categorical, then this
property is empty ([]
).
Data Types: single
| double
This property is read-only.
Expanded predictor names, returned as a cell array of character vectors.
If the model uses encoding for categorical variables, then
ExpandedPredictorNames
includes the names that describe the
expanded variables. Otherwise, ExpandedPredictorNames
is the same as
PredictorNames
.
Data Types: cell
This property is read-only.
Predictor names, specified as a cell array of character vectors. The order of the
entries in PredictorNames
is the same as in the training data.
Data Types: cell
This property is read-only.
Predictor values, returned as a real matrix or table. Each column of
X
represents one variable (predictor), and each row represents
one observation.
Data Types: double
| table
Response Properties
This property is read-only.
Name of the response variable, returned as a character vector.
Data Types: char
Function for transforming raw response values, specified as a function handle or
function name. The default is "none"
, which means
@(y)y
, or no transformation. The function should accept a vector
(the original response values) and return a vector of the same size (the transformed
response values).
Example: Suppose you create a function handle that applies an exponential
transformation to an input vector by using myfunction = @(y)exp(y)
.
Then, you can specify the response transformation as
ResponseTransform=myfunction
.
Data Types: char
| string
| function_handle
This property is read-only.
Class labels corresponding to the observations in X
, returned as
a categorical array, cell array of character vectors, character array, logical vector,
or numeric vector. Each row of Y
represents the classification of the
corresponding row of X
.
Data Types: single
| double
| logical
| char
| string
| cell
| categorical
Other Data Properties
This property is read-only.
Description of the cross-validation optimization of hyperparameters, returned as a
BayesianOptimization
object or a table of
hyperparameters and associated values. This property is nonempty if the
OptimizeHyperparameters
name-value argument is nonempty when you
create the model. The value of HyperparameterOptimizationResults
depends on the setting of the Optimizer
option in
HyperparameterOptimizationOptions
when you create the
model.
"bayesopt"
(default) — Object of classBayesianOptimization
"gridsearch"
or"randomsearch"
— Table of hyperparameters used, observed objective function values (cross-validation loss), and rank of observations from lowest (best) to highest (worst)
This property is read-only.
Number of observations in the training data, returned as a positive integer.
NumObservations
can be less than the number of rows of input data
when there are missing values in the input data or response data.
Data Types: double
This property is read-only.
Scaled weights in tree
, returned as a numeric vector.
W
has length n
, the number of rows in the
training data.
Data Types: double
Object Functions
compact | Reduce size of machine learning model |
crossval | Cross-validate machine learning model |
cvshrink | Cross-validate pruning and regularization of regression ensemble |
gather | Gather properties of Statistics and Machine Learning Toolbox object from GPU |
lime | Local interpretable model-agnostic explanations (LIME) |
loss | Regression error for regression ensemble model |
partialDependence | Compute partial dependence |
plotPartialDependence | Create partial dependence plot (PDP) and individual conditional expectation (ICE) plots |
predict | Predict responses using regression ensemble model |
predictorImportance | Estimates of predictor importance for regression ensemble of decision trees |
regularize | Find optimal weights for learners in regression ensemble |
removeLearners | Remove members of compact regression ensemble |
resubLoss | Resubstitution loss for regression ensemble model |
resubPredict | Predict response of regression ensemble by resubstitution |
resume | Resume training of regression ensemble model |
shapley | Shapley values |
shrink | Prune regression ensemble |
Examples
Load the carsmall
data set. Consider a model that explains a car's fuel economy (MPG
) using its weight (Weight
) and number of cylinders (Cylinders
).
load carsmall
X = [Weight Cylinders];
Y = MPG;
Train a boosted ensemble of 100 regression trees using the LSBoost
method. Specify that Cylinders
is a categorical variable.
Mdl = fitrensemble(X,Y,'Method','LSBoost',... 'PredictorNames',{'W','C'},'CategoricalPredictors',2)
Mdl = RegressionEnsemble PredictorNames: {'W' 'C'} ResponseName: 'Y' CategoricalPredictors: 2 ResponseTransform: 'none' NumObservations: 94 NumTrained: 100 Method: 'LSBoost' LearnerNames: {'Tree'} ReasonForTermination: 'Terminated normally after completing the requested number of training cycles.' FitInfo: [100×1 double] FitInfoDescription: {2×1 cell} Regularization: [] Properties, Methods
Mdl
is a RegressionEnsemble
model object that contains the training data, among other things.
Mdl.Trained
is the property that stores a 100-by-1 cell vector of the trained regression trees (CompactRegressionTree
model objects) that compose the ensemble.
Plot a graph of the first trained regression tree.
view(Mdl.Trained{1},'Mode','graph')
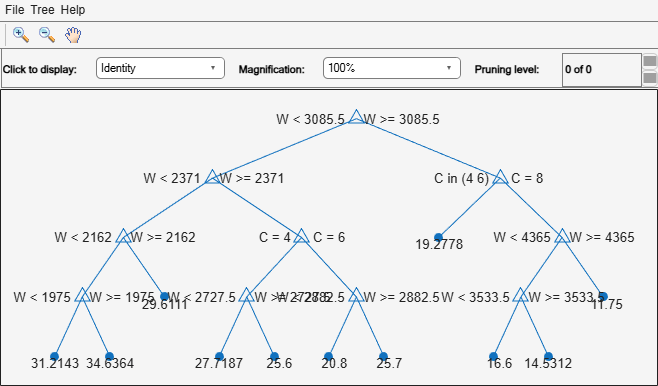
By default, fitrensemble
grows shallow trees for boosted ensembles of trees.
Predict the fuel economy of 4,000 pound cars with 4, 6, and 8 cylinders.
XNew = [4000*ones(3,1) [4; 6; 8]]; mpgNew = predict(Mdl,XNew)
mpgNew = 3×1
19.5926
18.6388
15.4810
Tips
For an ensemble of regression trees, the Trained
property
contains a cell vector of ens.NumTrained
CompactRegressionTree
model objects. For a textual or graphical display of
tree t
in the cell vector,
enter
view(ens.Trained{t})
Extended Capabilities
Usage notes and limitations:
The
predict
function supports code generation.To integrate the prediction of an ensemble into Simulink®, you can use the RegressionEnsemble Predict block in the Statistics and Machine Learning Toolbox™ library or a MATLAB® Function block with the
predict
function.When you train an ensemble by using
fitrensemble
, the following restrictions apply.The value of the
ResponseTransform
name-value argument cannot be an anonymous function.Code generation limitations for regression trees also apply to ensembles of regression trees. You cannot use surrogate splits; that is, the value of the
Surrogate
name-value argument must be"off"
.
For fixed-point code generation, the following additional restrictions apply.
When you train an ensemble by using
fitrensemble
, the value of theResponseTransform
name-value argument must be"none"
(default).Categorical predictors (
logical
,categorical
,char
,string
, orcell
) are not supported. You cannot use theCategoricalPredictors
name-value argument. To include categorical predictors in a model, preprocess them by usingdummyvar
before fitting the model.
For more information, see Introduction to Code Generation.
Usage notes and limitations:
The following object functions fully support GPU arrays:
The following object functions offer limited support for GPU arrays:
The object functions execute on a GPU if at least one of the following applies:
The model was fitted with GPU arrays.
The predictor data that you pass to the object function is a GPU array.
The response data that you pass to the object function is a GPU array.
For more information, see Run MATLAB Functions on a GPU (Parallel Computing Toolbox).
Version History
Introduced in R2011a
See Also
ClassificationEnsemble
| fitrensemble
| CompactRegressionEnsemble
| templateTree
| view
MATLAB Command
You clicked a link that corresponds to this MATLAB command:
Run the command by entering it in the MATLAB Command Window. Web browsers do not support MATLAB commands.
Select a Web Site
Choose a web site to get translated content where available and see local events and offers. Based on your location, we recommend that you select: .
You can also select a web site from the following list
How to Get Best Site Performance
Select the China site (in Chinese or English) for best site performance. Other MathWorks country sites are not optimized for visits from your location.
Americas
- América Latina (Español)
- Canada (English)
- United States (English)
Europe
- Belgium (English)
- Denmark (English)
- Deutschland (Deutsch)
- España (Español)
- Finland (English)
- France (Français)
- Ireland (English)
- Italia (Italiano)
- Luxembourg (English)
- Netherlands (English)
- Norway (English)
- Österreich (Deutsch)
- Portugal (English)
- Sweden (English)
- Switzerland
- United Kingdom (English)